
How to Explore Prometheus with Easy ‘Hello World’ Projects
In this blog post, I would like to share with you some of the projects that I used to to get a better sense of what Prometheus can do. I am a very hands-on type of learner, and usually when I want to explore new technologies, I start with “hello world” apps and small toy projects. Therefore, the main goal of this blog is to share with you how easily you can set up Prometheus and how quickly you can create simple projects that can be monitored with Prometheus and visualized in Grafana. 🧡 I have found a lot of great materials and inspiration on this curated list. 🚀
Setting up Prometheus
As a first step, I would suggest creating a dedicated Prometheus folder to store everything Prometheus-related and all of your toy projects. In this Prometheus folder, I created a server folder, where I’ve downloaded and set up the Prometheus monitoring system.
mkdir Prometheus/server
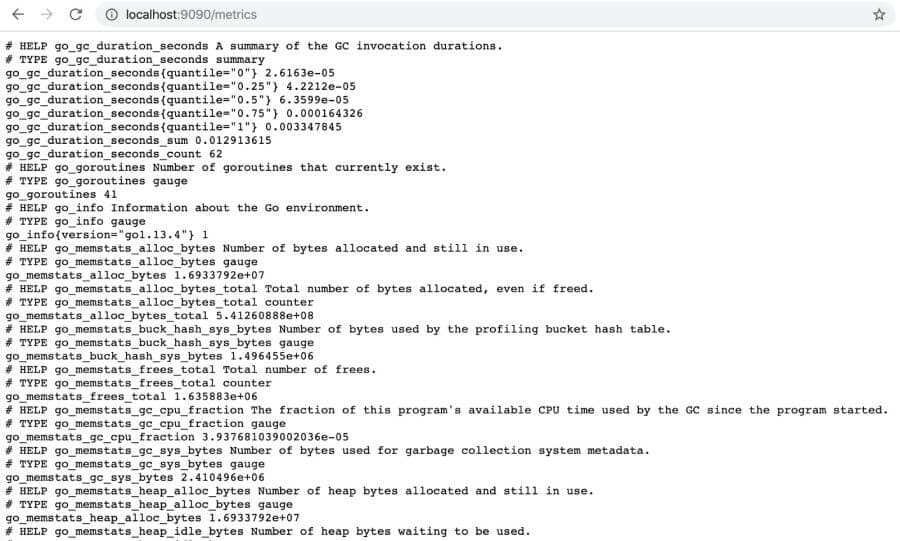
The Prometheus starting guide is amazing and very straightforward. I don’t think it makes much sense to repeat what’s there (because I would literally just copy-paste it), and therefore, I am just going to link it here. Follow the steps to set up Prometheus (download → extract → configure → start → explore and play). Prometheus is serving metrics about itself. You can start to explore its metrics right away.
Collecting metrics from Prometheus alone isn’t the greatest or most interesting representation of Prometheus capabilities. That’s why you should check out the following projects that I’ve used to get a better sense of what Prometheus can actually do:
- Monitor your own computer system with Node Exporter
- Monitor express application with Prometheus Middleware
- Monitor Github repos with Github Exporter
1. Monitor Your Own Computer System with Node Exporter
Set up Node Exporter
For well-known applications, servers, or databases, Prometheus and its amazing community have built exporters that you can use in order to monitor your targets. Exporters are basically any scripts or services that fetch specific metrics from your system and then give data in Prometheus format. This is the main way of monitoring targets with Prometheus.
Node Exporter is a Prometheus exporter that exposes a wide variety of hardware- and kernel-related metrics. This means that we can use Node Exporter to monitor filesystems, disks, CPUs, network statistics (and others) of our own computer system. For Node Exporter, I have created a new folder to set it up.
mkdir Prometheus/node_exporter
You can follow (another) amazing guide by Prometheus to set up Node Exporter (once again, download → extract → configure → start → explore and play). The end result of the guide is Node Exporter running and exposing metrics on http://localhost:9100/, and Prometheus scraping metrics from that Node Exporter at http://localhost:9090/.
Visualize the Metrics from your System with Grafana
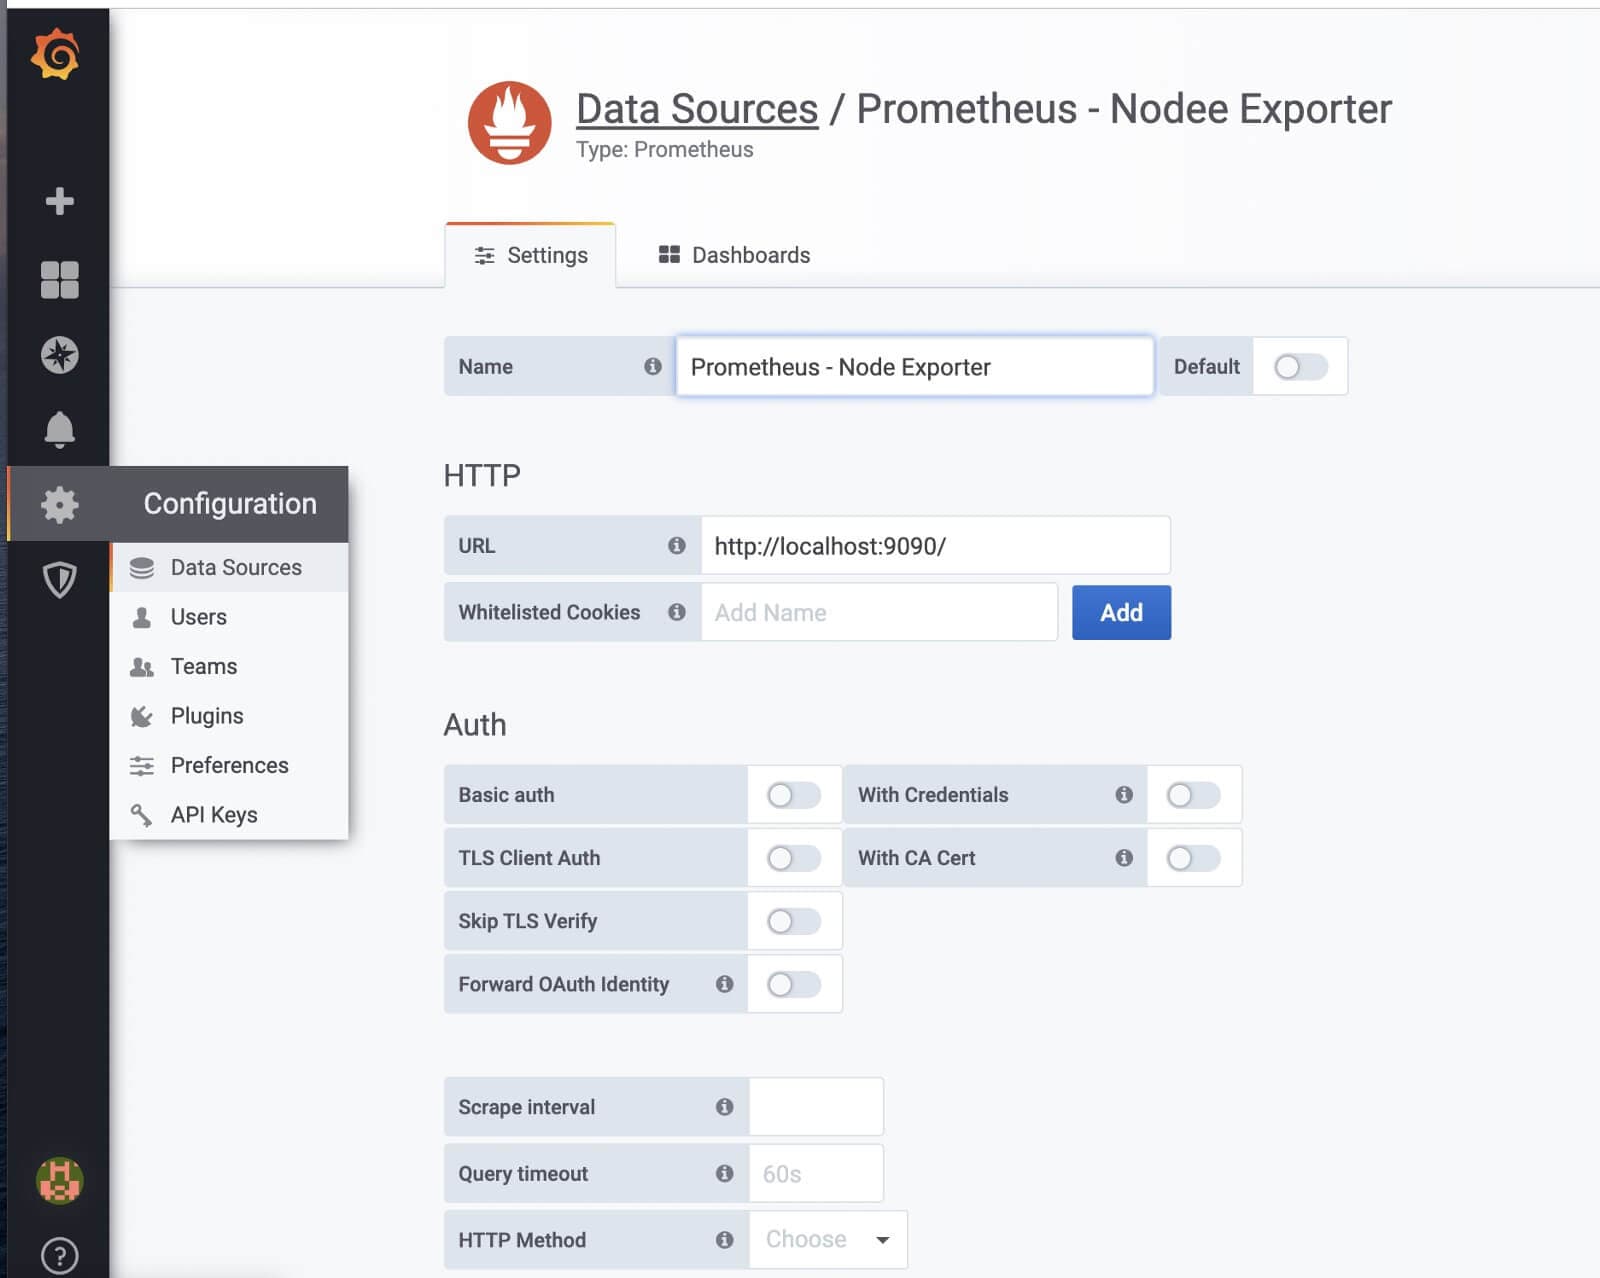
If you are new to Grafana, as a first step, please follow the Grafana installation guide. As soon as you have your Grafana up and running, connect your Prometheus data source (I have named mine Datasource Prometheus - Node Exporter) that is served at http://localhost:9090/.
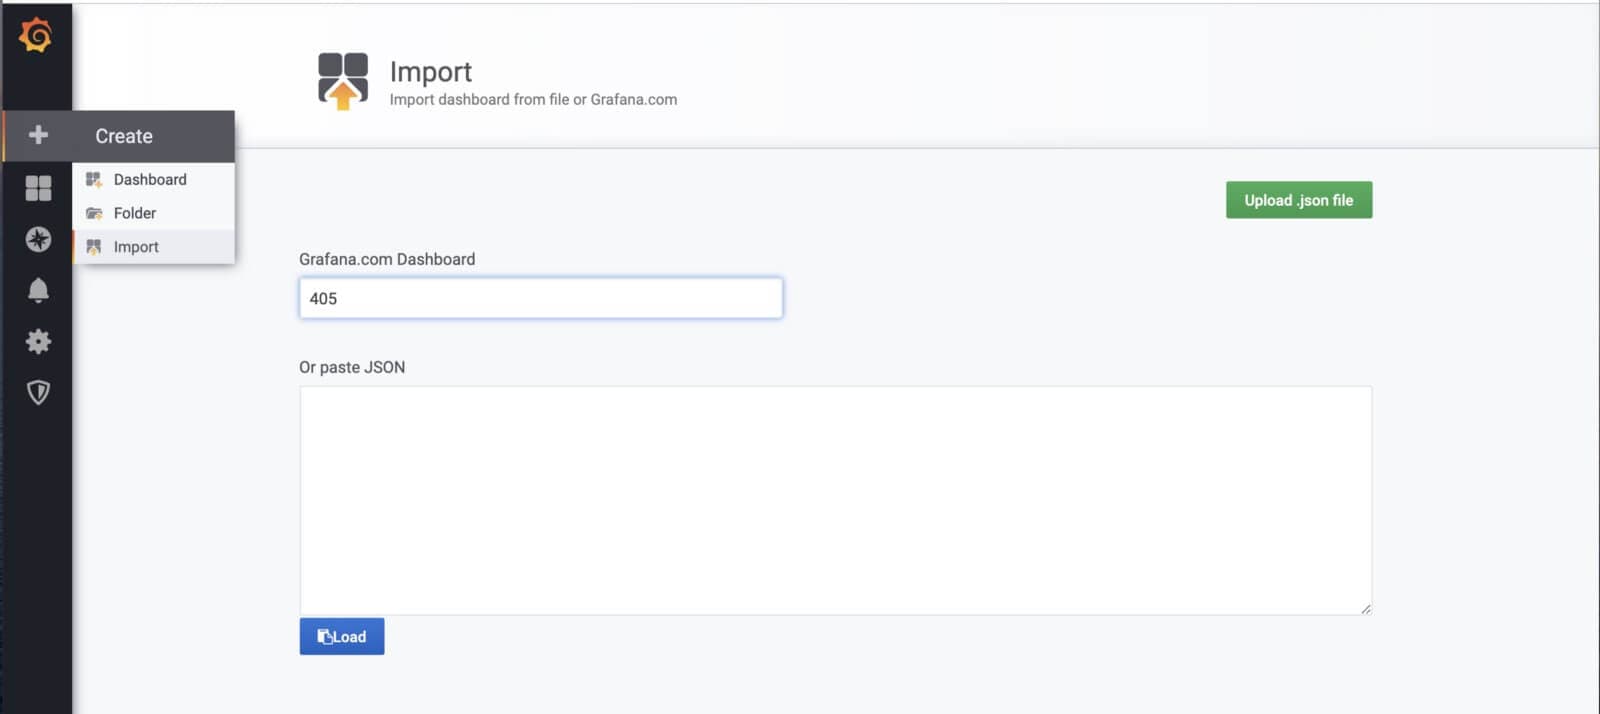
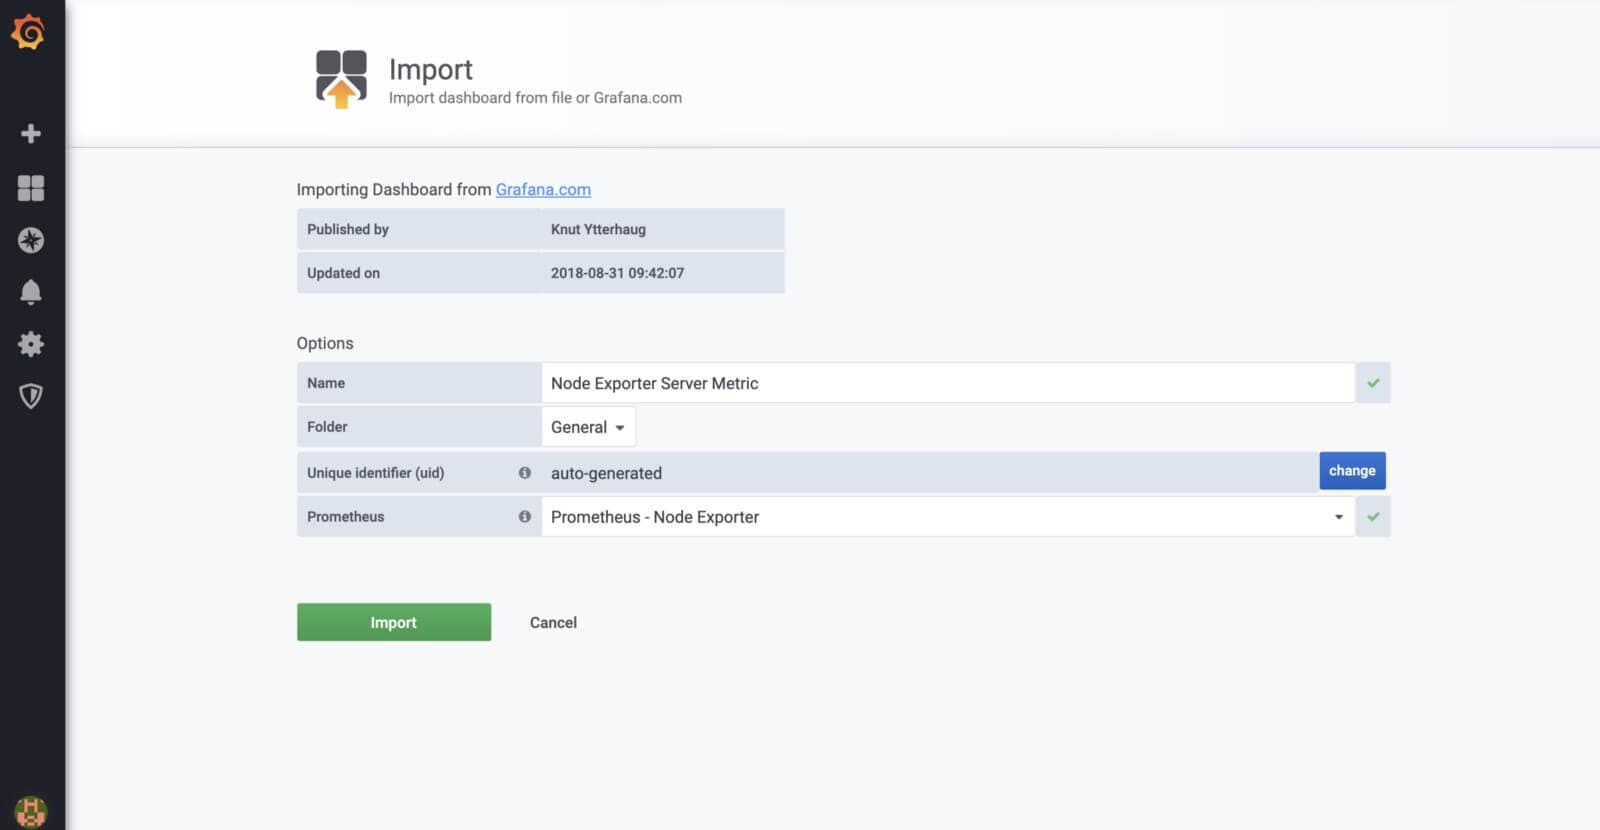
After connecting your data source, you can import the Node Exporter Server Metrics Dashboard, which contains pre-made dashboards to visualize metrics from your computer. To import the dashboard, just copy its Dashboard ID (405), and use Import.
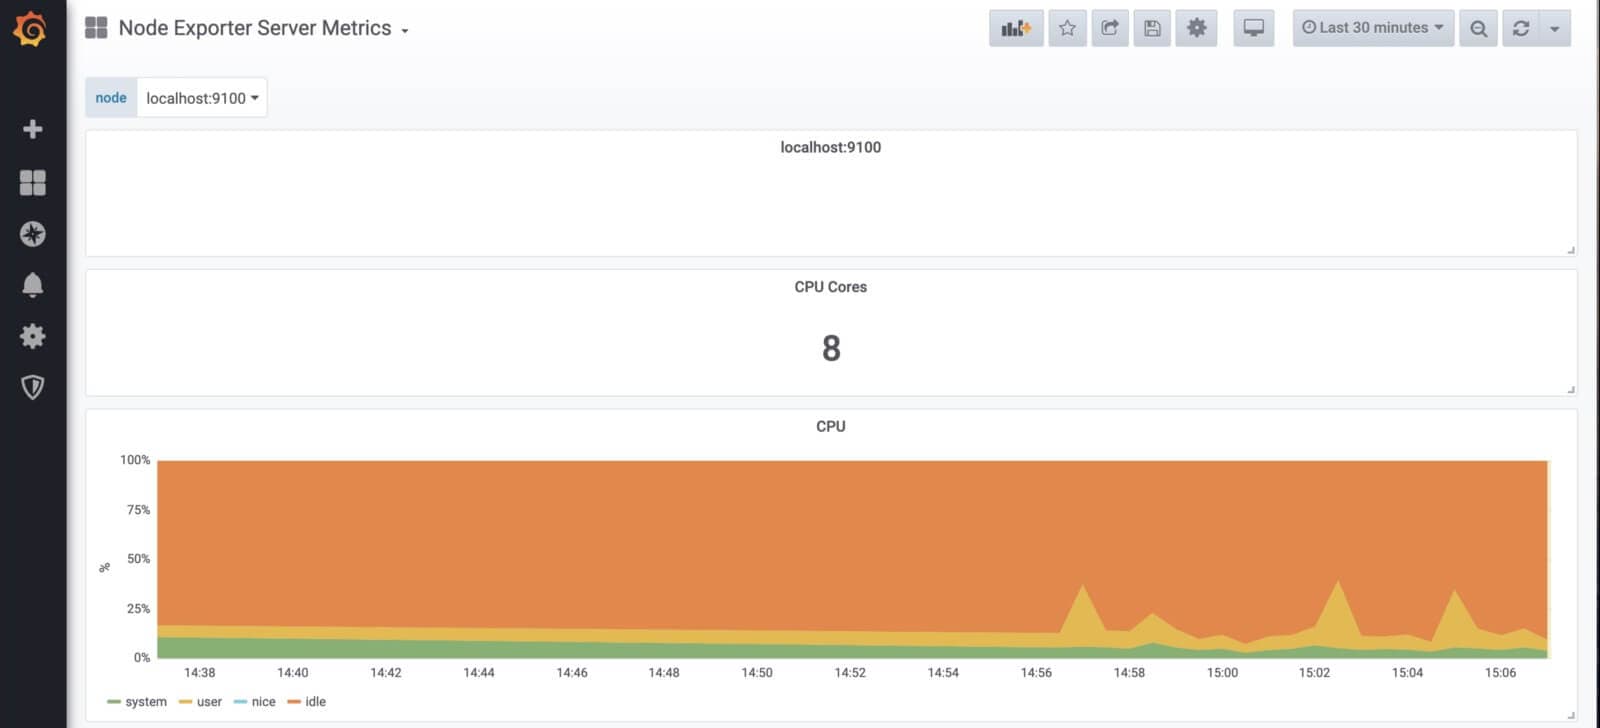
You are now able to see visualized metrics from your own computer system.
2. Monitor Express Application with Prometheus Middleware
As a second project, I have decided to add Prometheus Middleware to the express application and monitor its performance. If you don’t have any particular application ready, you can use the boilerplate below to create the toy app. For this project, I have once again created a new folder.
mkdir Prometheus/prom_middleware
cd Prometheus/prom_middleware
code .
In the prom_middleware I have created an index.js file and run yarn init. After that, I have run yarn add express express-prometheus-middleware to add packages that we are going to use. You can use the boilerplate below to create your toy app.
const express = require('express');
const promMid = require('express-prometheus-middleware');
const app = express();
const PORT = 9091;
app.use(promMid({
 metricsPath: '/metrics',
 collectDefaultMetrics: true,
 requestDurationBuckets: [0.1, 0.5, 1, 1.5],
}));

app.get('/', (req, res) => {
 console.log('GET /');
});
app.get('/hello', (req, res) => {
 const { name = 'you' } = req.query;
 res.json({ message: `Hello, ${name}!` });
 console.log('GET /hello');
});
app.get('/hi', (req, res) => {
 const { name = 'you' } = req.query;
 res.json({ message: `Hi, ${name}!` });
 console.log('GET /hi');
});
app.listen(PORT, () => {
 console.log(`App listening at <http://localhost>:${PORT}`);
});
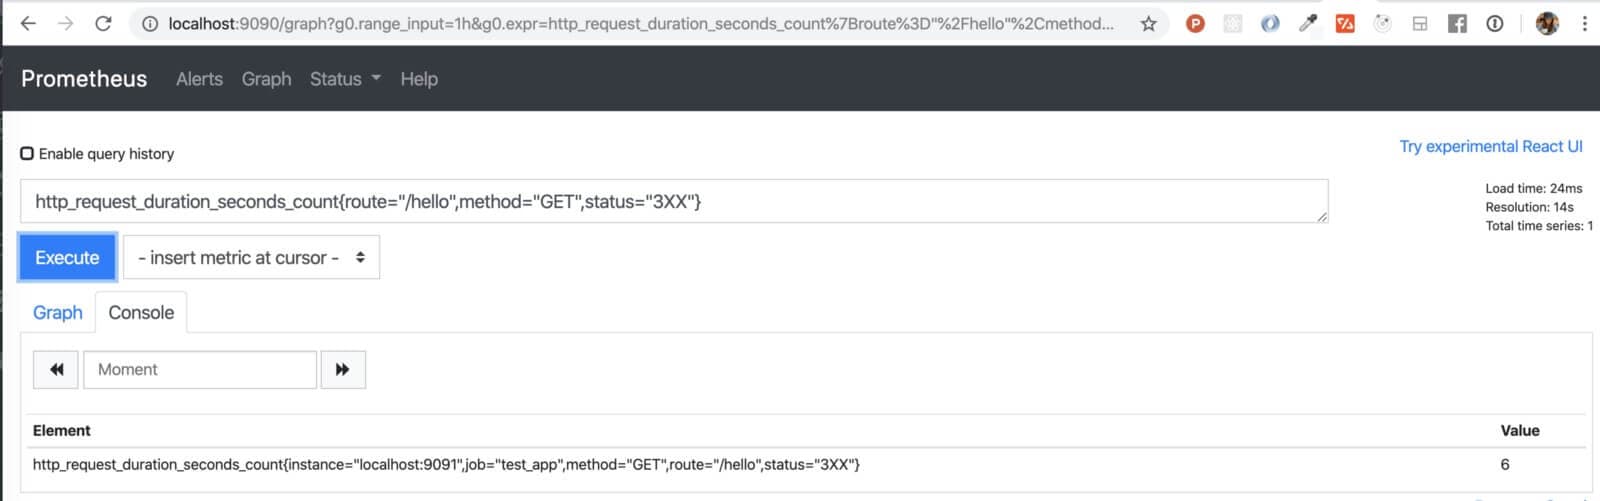
It is important to not forget to add prom_middleware job to prometheus config file and restart prometheus server by re-running ./prometheus -- config.file=prometheus.yml. Or you can start Prometheus with --web.enable-lifecycle flag and then use http://localhost:9090/-/reload endpoint, which automatically reloads when Prometheus config changes. You can then run this app by node index.js, and open its routes (/hi and /hello) several times, to be able to see apps metrics.
- job_name: 'prom_middleware'
scrape_interval: 5s
    static_configs:
        - targets: ['localhost:9091']
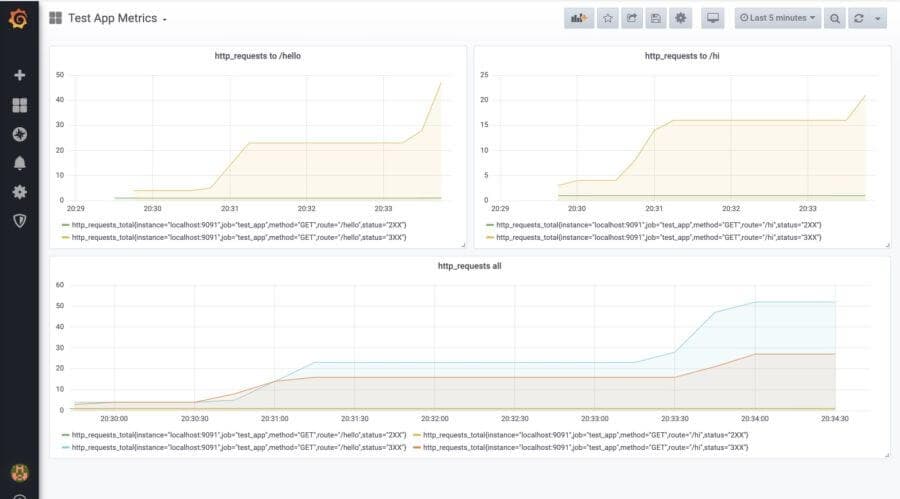
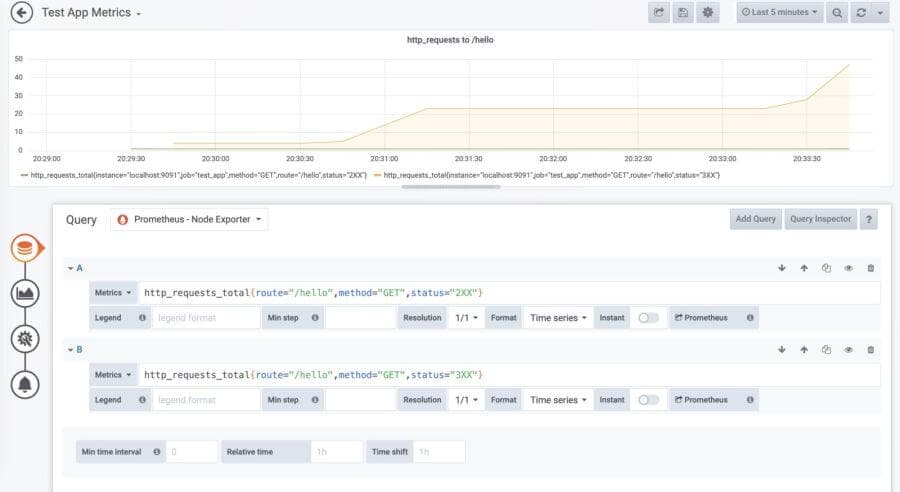
Visualize the Metrics from the App with Grafana
If you have connected your Prometheus to Grafana in the previous step, you are now able to create dashboard and panels for the prom_middleware application metrics. See example below:

3. Monitor GitHub Repos with Github Exporter
As a last project, I’ve decided to try Prometheus to monitor GitHub repos using github-exporter. To do this, you are going to need Docker Compose. You can install Docker Hub (containing Docker Compose) via its official site.
As soon as your Docker is up and running, you can continue with the next steps – running docker image below. You can replace prometheus/prometheus repo with any repo of your choice.
docker run -d --restart=always -p 9171:9171 -e REPOS="prometheus/prometheus" infinityworks/github-exporter
After running this docker image, you need to add github_exporter to prometheus config file and restart the prometheus server by re-running ./prometheus --config.file=prometheus.yml.
- job_name: 'github_exporter'
    scrape_interval: 5s
    static_configs:
        - targets: ['localhost:9171']
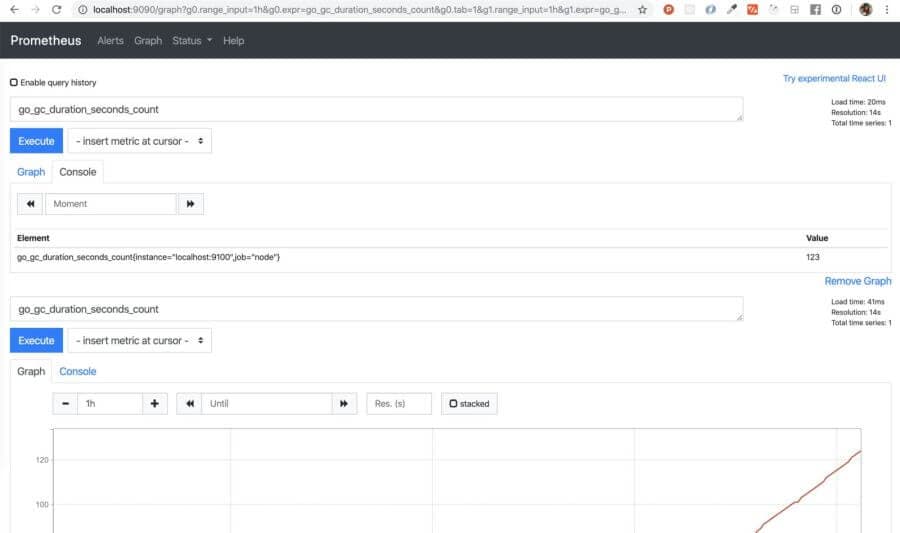
You can now use Prometheus to run the queries.
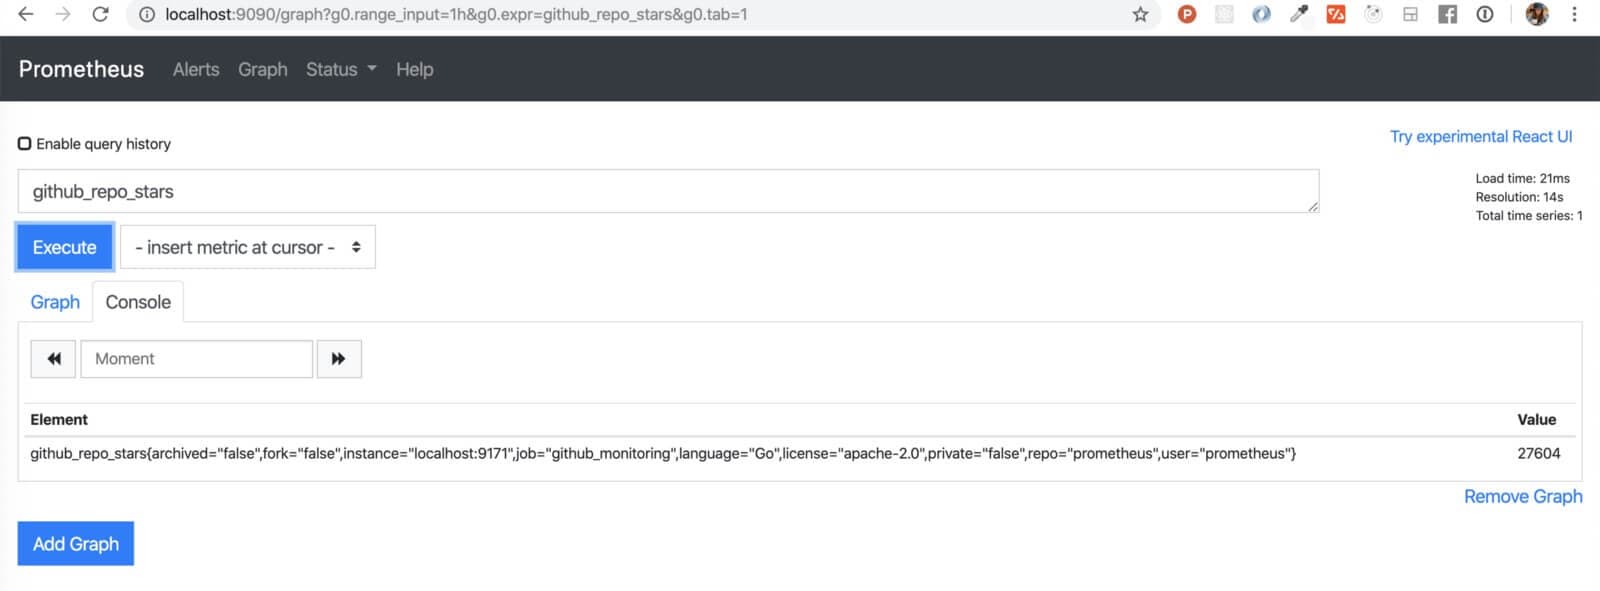
Unfortunately, GitHub limits the number of queries from each IP address, and you can make only 60 queries/hour from unauthorized users. That’s why I would suggest that you create your own docker image and supply your github token.
mkdir Prometheus/github_exporter
cd Prometheus/github_exporter
touch docker-compose.yml
code .
Create docker-compose file. (For more information, visit github-exporter README.)
github-exporter:
   tty: true
   stdin_open: true
   expose:
     - 9171
   ports:
     - 9171:9171
   image: infinityworks/github-exporter:latest
   environment:
     - REPOS=prometheus/prometheus
     - GITHUB_TOKEN=yourGITHUBtoken
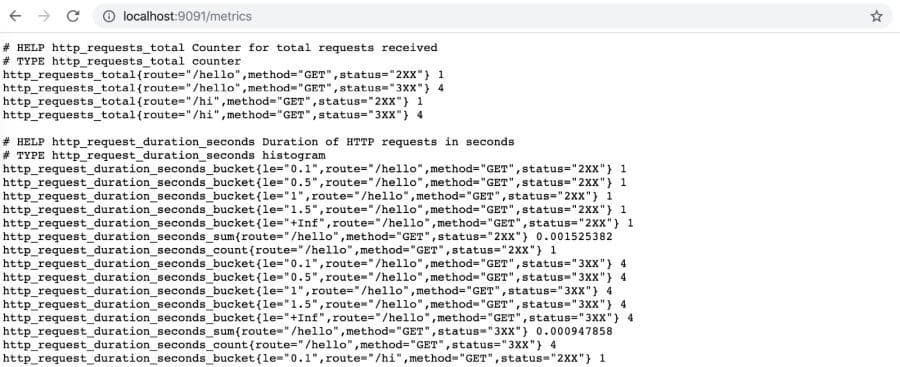
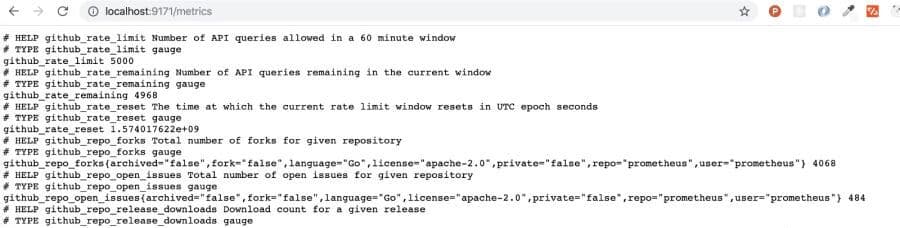
Run docker-compose up and visit http://localhost:9171/metric to see the available metrics.
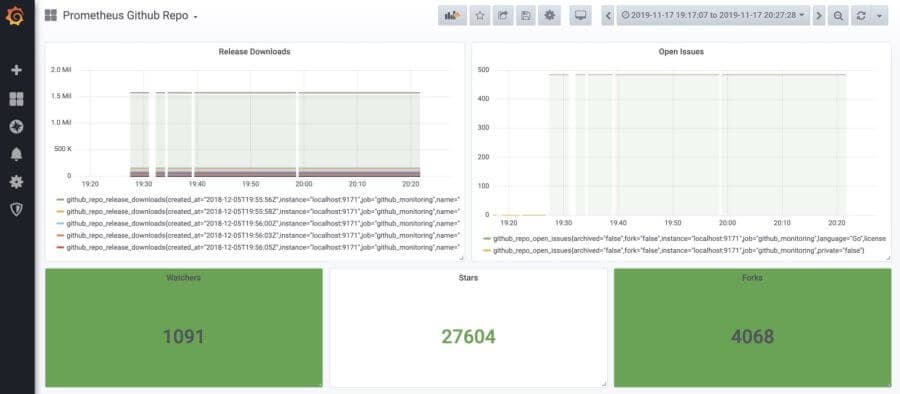
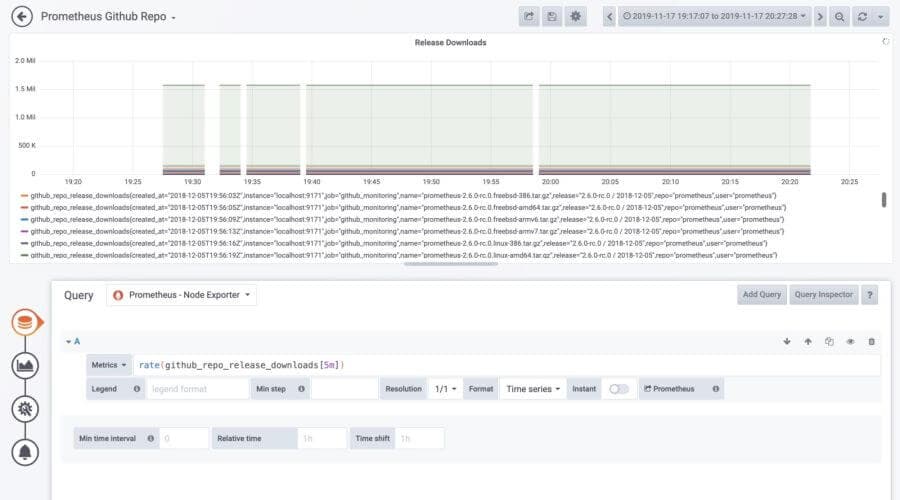
Visualize the Metrics from the App with Grafana
And once again: If you have added your Prometheus as a datasource to Grafana in one of the previous steps, you are now able to create dashboards and panels for the github_exporter metrics. See example below.
And that’s it!
If you have any other tips or tricks on how to use Prometheus, please let us know! 🙂

