How to Stream Sensor Data with Grafana and InfluxDB
Building dashboards that show real-time streaming data and allow for interactive queries is challenging. At the recent InfluxDays conference in San Francisco, Ryan McKinley, Grafana Labs VP of Applications, discussed new approaches to integrate real-time data into Grafana dashboards.
Prior to joining Grafana, McKinley worked at a renewable energy startup, Natel Energy, which builds hydropower turbines. There, he used Grafana and Influx to display an overview of how the systems were working.
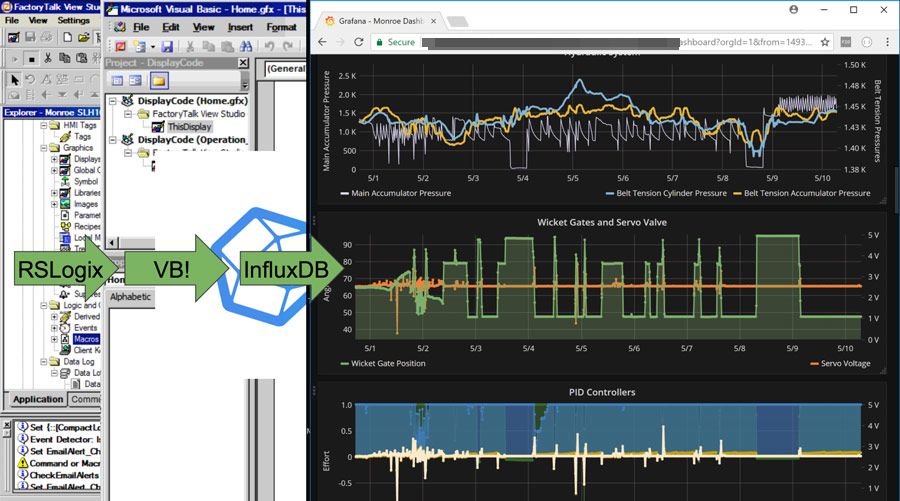
When operators have access to the nice dashboards showing current operating conditions, they get excited to see the behavior over larger time scales. They start with a dashboard — refreshing every five seconds — and zoom out to show the last two weeks, or the last two years.
“You have to be really careful about how you do this,” McKinley explained during his talk. “So I got really excited a few years ago for intelligent roll-ups and querying of aggregate data. I thought, Influx is going to solve this all for me.” As most people do, he used a series of roll-ups to query the data and put it into a new database, based on a time range using Flux.
However, inputting the data on the control side could be challenging. That’s where Grafana’s ability to insert custom components in the controls came in handy – whether it’s a start and stop button or setting up guide vane angles. While this method worked, it was hard to maintain since there were so many plugins and so much data manipulation.
At this point, McKinley started working at a residential solar company, where the goal was to change how solar was sold, from a construction project to an appliance sale, using a single system. They wanted to use hardware to guarantee the system was safe so that there wasn’t a need for building inspectors to come out. But they still wanted to have the lowest power infrastructure with live debugging and without a system administrator.
“When you have expensive hardware, you can put the resources into someone who’s going to care about how well that database works,” he said. “But when you’ve got cheap resources, no one’s ever gonna look at that.”
With that in mind, he said his challenge became: “How can I have live real-time data come off these very inexpensive devices and see it in real time, but then send aggregate data and key events to the cloud where we have the resources to maintain it in aggregate.”
On that note, he began pushing to see how Grafana supports queries and streaming. He started looking at how a range of databases, from powerful Influx sources to simple CSV files, could work together. What he came up with was a straightforward streaming site that wrote a CSV file – and it was at this point that he joined Grafana Labs to focus on industrial and analytic solutions.
Sharing Dashboards Across Queries
Before moving on to the demo, McKinley noted that the Grafana query interface changed behind the scenes in early October. “Instead of being a simple request response, you request data… and now every query returns an observable of the response… so that every Grafana query essentially is able to continue to update itself,” he said. “I’m pretty excited about that because that changes what’s possible pretty dramatically.”
McKinley then debuted some new features (ones that the UX team hadn’t even seen yet!). He started by creating a new dashboard in Grafana and added a query to collect the last one minute of data.
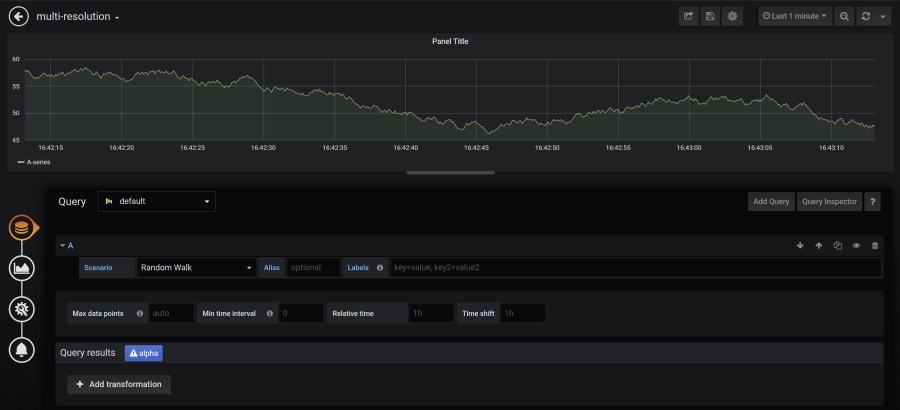
But after the graph shows up, there’s the issue of how to deal with the roll-ups.
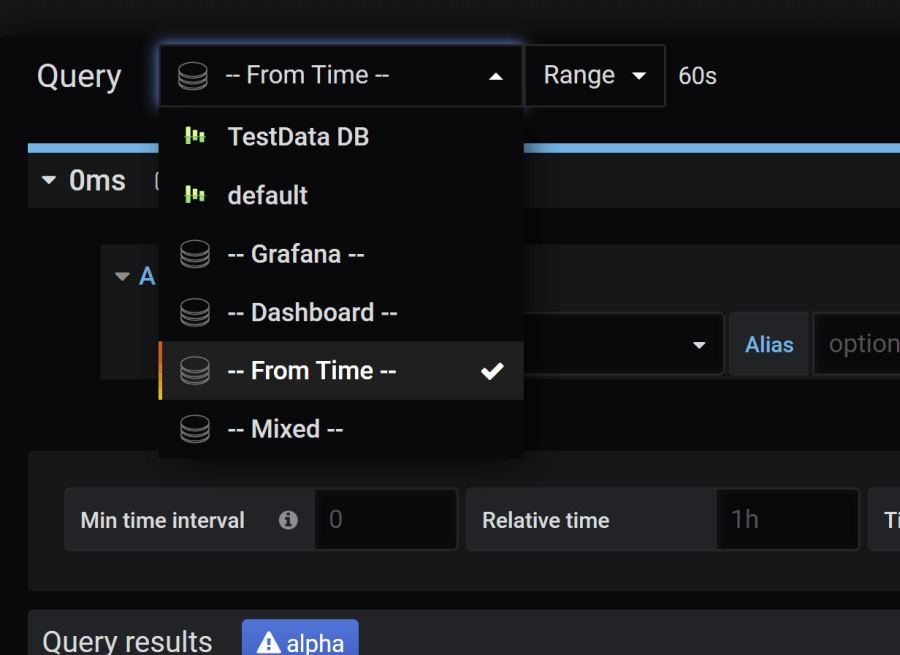
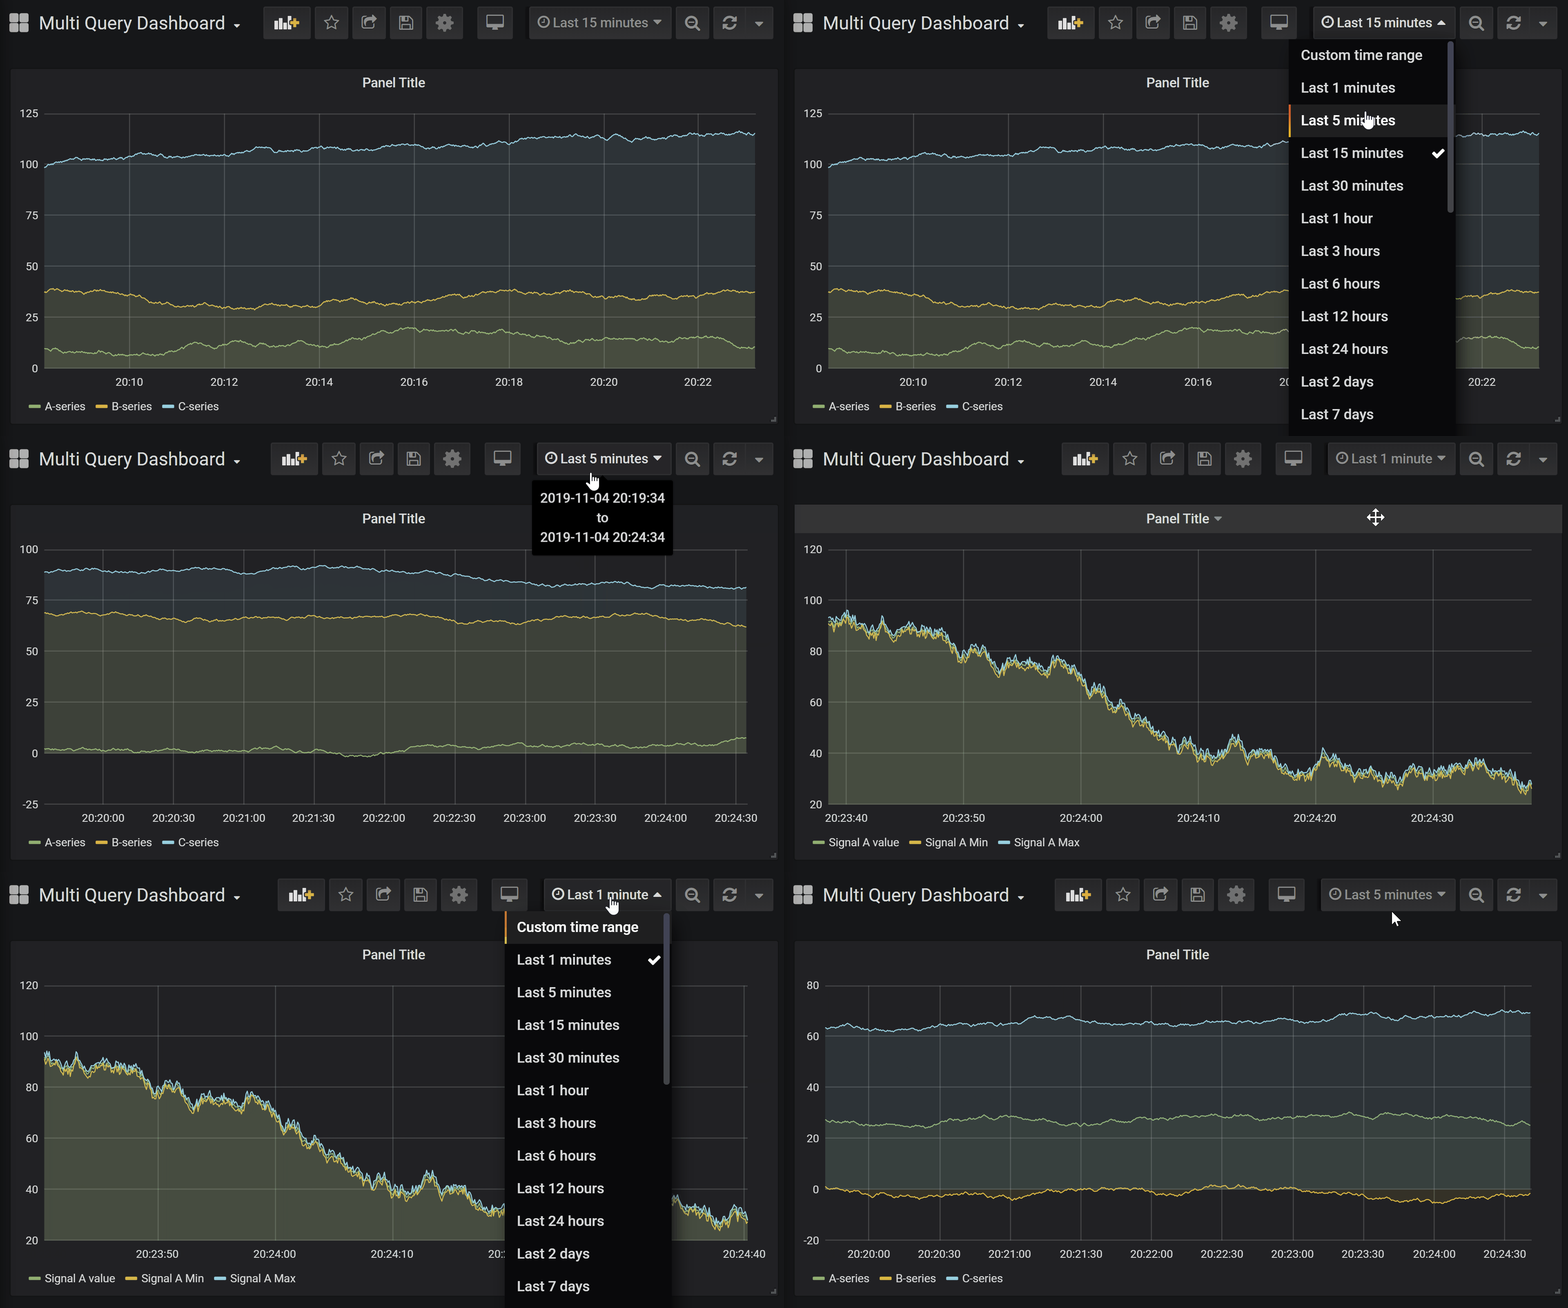
So McKinley added a new type of data source that can be accessed in the drop-down menu called “From Time.” Using that, the query switches to running within the designated amount of time. But now you can also zoom out and run another query.
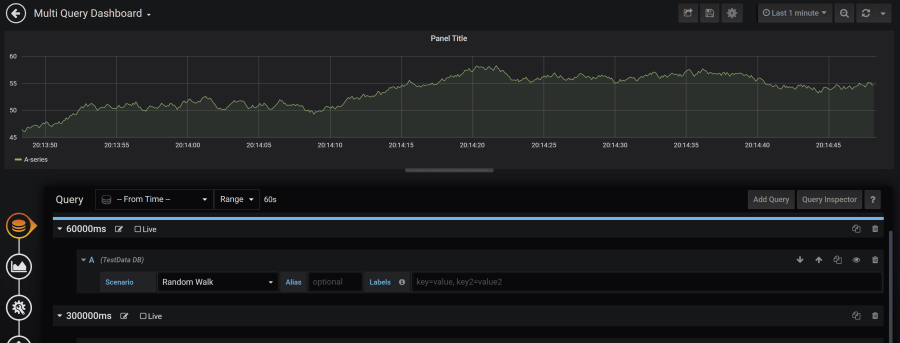
“What’s interesting about Flux and where we’re going with Chronograph is that… if you know what you’re looking at, you don’t really want people creating queries,” he said. “You want to see what you’re doing, and those queries are different at different resolutions.”
Importing Live Streaming Data
But when it comes to live streaming data, things appear slightly different. “The event’s coming in and rather than getting a query to get back the whole response, we’re just getting events as they come to us, and then adding them up to see a real-time stream of this information,” McKinley explained. To work with that data, he then added a query with a time set to run until “now” to stop the streaming info from coming in.
Grafana does have a little-known feature that allows for mixed data sources. “From that, each time you add a query, you also specify which database you’re going to,” he said. “So that’s a way of having everything in the same panel for the same query and hitting multiple data boards.”
Gauging the Results
Now comes the challenge of showing a portion of the data without having to go back and rebuild all the queries. Instead, McKinley added a gauge to reference the data using the same results as before. “So now I’m just gonna broadcast the results to multiple panels,” he said. “This is not a new query. Essentially, as things get queried, the results get sent to two panels.”
“We set up a complicated idea of a query that could perhaps be zoomed all the way in,” he continued, noting that the web socket is getting changes and there’s a query from Influx and several different roll-ups to consider. ”Those are hard to create with a single query that you could use to represent that variety of changes with just template variables,” he said. “But it’s also a little wonky in general.”
So he made a copy of the data and added a bar gauge – now the results that were showing were exactly what was put in. “You have to manipulate your query to get the exact results you want to see,” he added. “Now I’ve got the same data as my overly complex query at the beginning where I set up multiple resolutions. I reuse that same effort across my dashboard so that these are not as cumbersome as they’ve been in the past. I’m also allowing more of a fluid interaction between these things so that we can leverage the power of the database when it exists, but also allow a much lower resource databases to play in the same space.”
When the gauge component was released, it eliminated the need for a composite panel. “Now if I want to reuse those, I can put a bar gauge next to a gauge and use it as a programmer,” he said. “But what you really want to do is avoid that second query. You can use this instead by configuring a query and building up multiple panels to use it.”
Future Integration in the Industrial Space
“Grafana has a lot of energy and effort put towards DevOps stories, and I’m looking much more at how do we exist in an industrial space, which requires real-time, immediate feedback, and the fewest steps in between you and the SCADA system,” McKinley concluded. “These are the types of problems I’m interested in.”

