
New in Grafana 6.4: Loki Annotations
Since we released Loki, our log aggregation system, our customers have been asking about using it not only for logs but also for less frequent events. Even though the strength of Loki lies in its ease of operation and automatic labeling for high-frequency logs, it can also be used for events out of the box.
One thing that was missing in Grafana, though, was enabling Loki as an annotations query source. Annotations are an amazing feature in Grafana that can help you get even more insights into your systems, as it lets you overlay any kind of events over your graphs. For example, you can overlay opening or closing windows in your greenhouse over your temperature graph, application deploys over your web service error rate, or people’s arrivals and departures over your smart home’s electricity consumption.
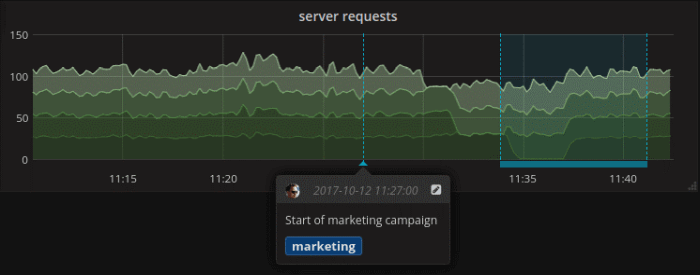
Before Grafana 6.4, there was no way to see data from Loki in dashboards at all. But now you can not only visualize your logs in Logs panel but also use Loki for annotations and either overlay data from your existing log streams as annotations or use Loki as a lightweight solution to other valuable events. This helps you get even better insights into your system behavior.
To get started, you could either use your existing logs and get your events from them if they are already part of your event stream, or you can manually send your events as a new log stream.
If you want to use existing logs you can use the LogQL language to filter your logs and get only relevant events out of them. For example, to filter only panic messages:
{app=your-app} |= “panic”Or to get deploy events from Kubernetes:
{job="default/eventrouter"} |~ "\"kind\":\"Deployment\""The other way is to manually send the events to Loki. Loki’s API allows you to send events with simple POST and JSON encoded payload so it is easy to integrate with any tools you already have.
So let’s see how you could quickly use Loki for annotations by manually generating events:
1. Run a Loki instance locally if do not have it already. You can either follow instructions here or use existing Docker images.
2. By default Loki uses Promtail agent to scrape the logs and label your log streams. For this demo we will use a simple bash script to push events into Loki manually from command line:
- Create script (this script expects Loki to be running locally on port 3100)
$ cat > loki_push.sh << ENDOFFILE
#!/bin/bash
NOW=\$(date -u +%FT%TZ)
LINE=\$1
DATA="{\"streams\": [{ \"labels\": \"{application=\\\\\"my-test-application\\\\\", type=\\\\\"events\\\\\"}\", \"entries\": [{ \"ts\": \"\${NOW}\", \"line\": \"\${LINE}\" }] }]}"
echo 'Seding ' \${DATA}
curl \\
  -H "Content-Type: application/json" \\
  -XPOST "http://localhost:3100/api/prom/push" \\
  --data-raw "\$DATA"
ENDOFFILE$ chmod +x loki_push.sh- Push messages to Loki:
$ ./loki_push.sh “My message”3. Set up Loki as a datasource if you do not have it already. See instructions here.
4. You can check that the message is in Loki using Explore with query {application="my-test-application",type="events"}. You can learn more about the query language in the documentation.
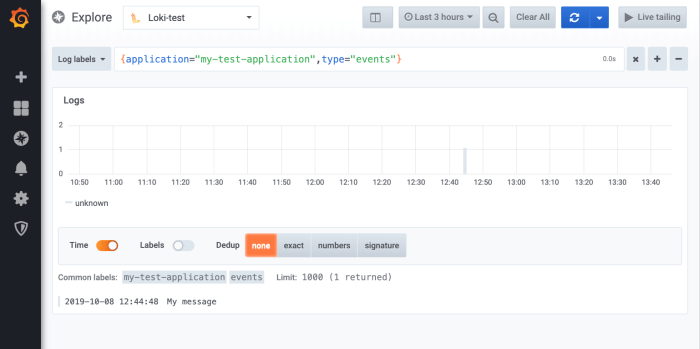
5. Create a dashboard with a simple Graph panel. You can use random walk from Test Data data source.
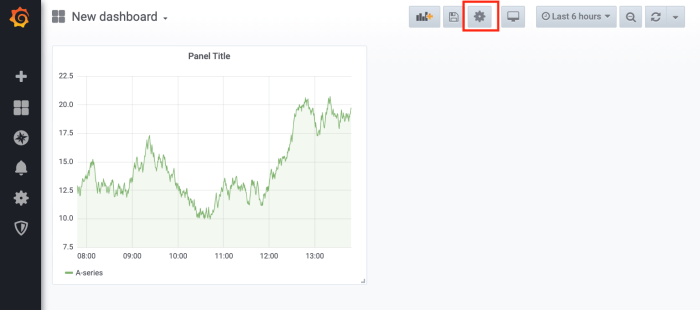
6. Open dashboard settings.
7. Open annotations tab.
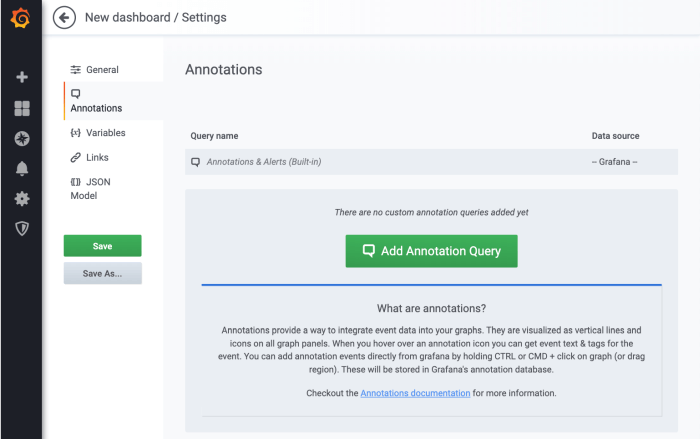
8. Click Add Annotation Query, fill in the name, and choose your Loki data source from the data source picker. Fill in the Loki query to filter your test events that we pushed in step 2: {application="my-test-application",type="events"}.
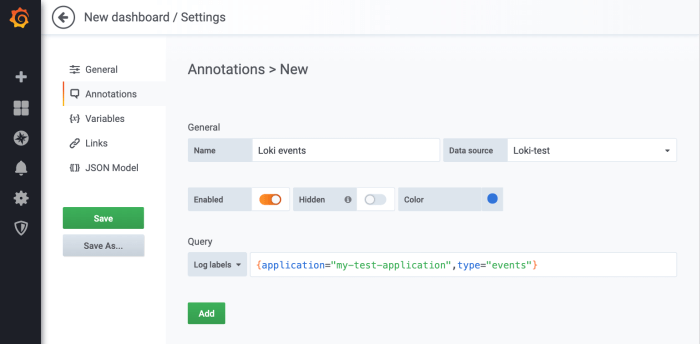
9. Click Add and go back to your dashboard. The graph panel we created should show annotations we pushed in the second step.
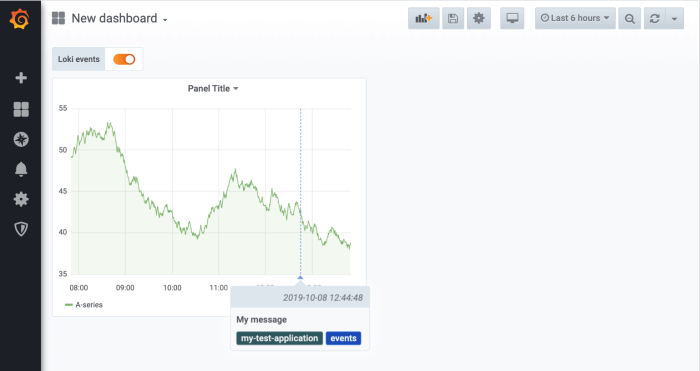
I hope this helps you get started with Loki and annotations. You can find more information about Loki and how to use annotations in Grafana dashboards in their respective documentations:
Troubleshooting
- Make sure your Loki instance is running and accepts connections on port 3100. If it is not, you will get an error either in step 2 when pushing the message or in step 3 when setting up the datasource.
- If you do not see any annotations in the dashboard, make sure the annotation query is correct and that you can see the message using Explore as in step 4. Also make sure that your dashboard time range looks enough into the past to see the annotation.
