How to Do Effective Infrastructure Monitoring for Linux with Grafana
Grafana Labs has 8+ clusters in GKE running 270 nodes of various sizes, and all the hosted metrics and hosted log Grafana Cloud offerings are run on 16-core, 64-gig machines. At the recent All Systems Go! conference in Berlin, David Kaltschmidt, Director, User Experience, gave a talk about what monitoring these clusters and servers looks like at Grafana Labs and shared some best practices.
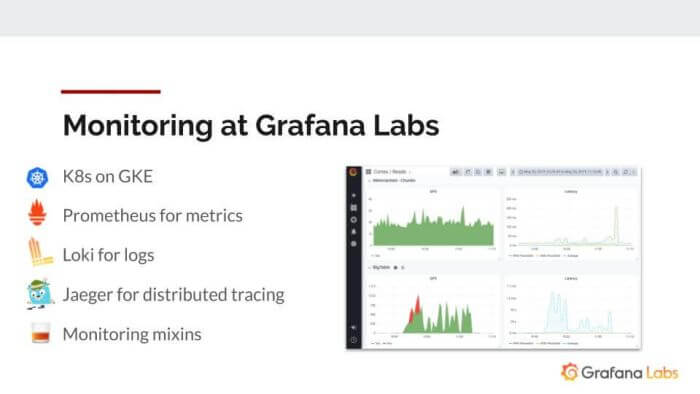
This infrastructure monitoring involves Prometheus for metrics, Loki for logs, and Jaeger for distributed tracing, along with monitoring mixins.
Alerting
At Grafana Labs, “we make dashboarding software, but we don’t want to look at dashboards all day,” Kaltschmidt said. “So we try to just have monitoring by alerting, using the time series that we produce and write alerts that only page us when things are happening.”
That requires the team to make sure that anyone who receives a page will have meaningful dashboards and good procedures in place. This is achieved with Prometheus using the node exporter, which is a service running on the host that collects hardware and OS metrics exposed by *NIX kernels. It’s written in Go with pluggable metric collectors.
With so many collector modules, Kaltschmidt said he sought the advice of GitLab’s Ben Kochie, who referred him to this diagram:
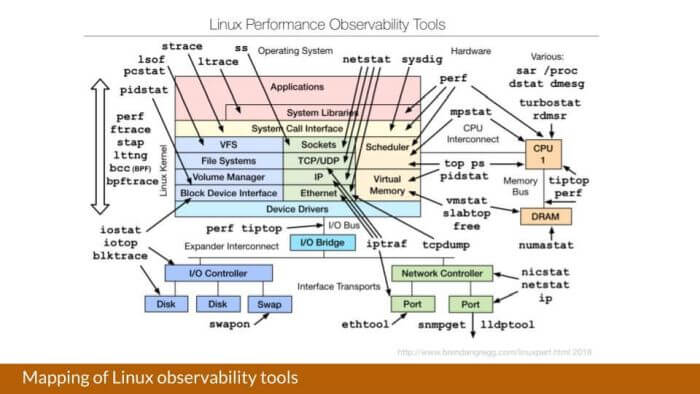
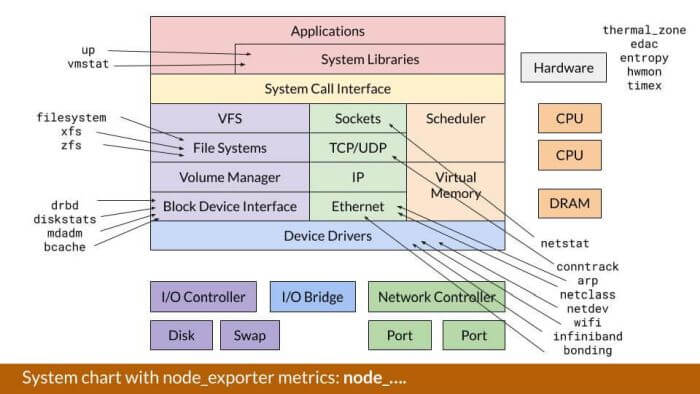
“Ben has been using a bunch of these in his day-to-day job, but the bigger task for him is always how can we also have the information that these tools provide in a sort of time series,” Kaltschmidt said. “Luckily, it has a bit of overlap with what node exporter gives you, and for us it became a challenge: How can we map node exporter metrics to what we need to cover in the parts of a Linux system?”
The resulting graphic maps the metrics exported by node exporter to the parts of a Linux system. (The terms on the graphic are the module names; the metrics are named node_ followed by the module name.)

Metrics Used
CPU Utilization
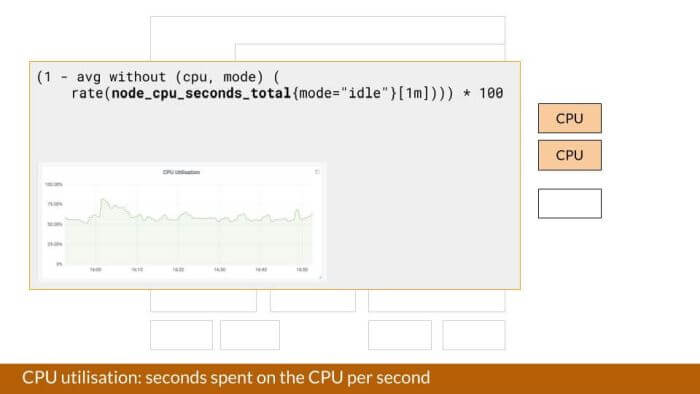
This is a classic example of a metric used for monitoring infrastructure. “The time series node_cpu_seconds_total gives you the second spend in CPU in the wall clock time in the various modes that the CPU supports,” said Kaltschmidt. “So you have system, user, idle, guest, etc., and all these different modes. Here we’re making use of this metric to draw the utilization graph where 100% would be nothing running in idle mode, and 100% of the CPU being used by processes in non-idle mode.”
CPU Saturation
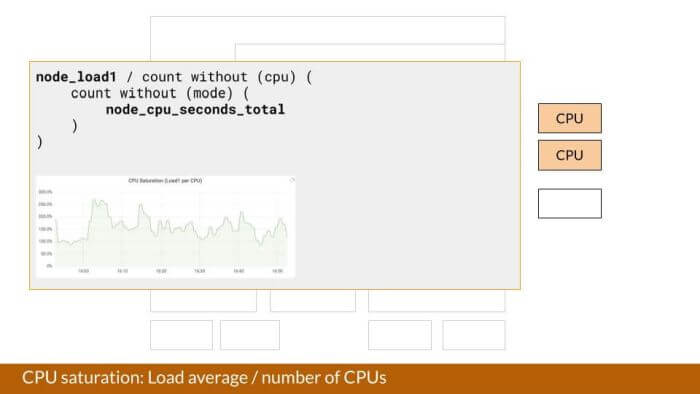
A similar metric used for saturation is average load, but it’s “not really ideal because it’s not just CPU-bound, because it also tracks now a lot of uninterrupted task code paths, which aren’t necessarily a reflection of how resource-bound your CPU is,” Kaltschmidt said. Plus, “we had to always normalize it by the number of CPU cores to have a zero to 100% saturation scale.”
So instead, the team is hoping to use node_pressure, the pressure stall indicator, which is a new way of monitoring how much demand there is on the system from a CPU point of view. “We’re no longer tracking just the number of threads that are waiting for the processor,” he said, “but we’re actually tracking the waiting time, so we’ll get a better sense of how contested that resource is.” Note: This metric is only available for newer kernels.
Memory Metrics
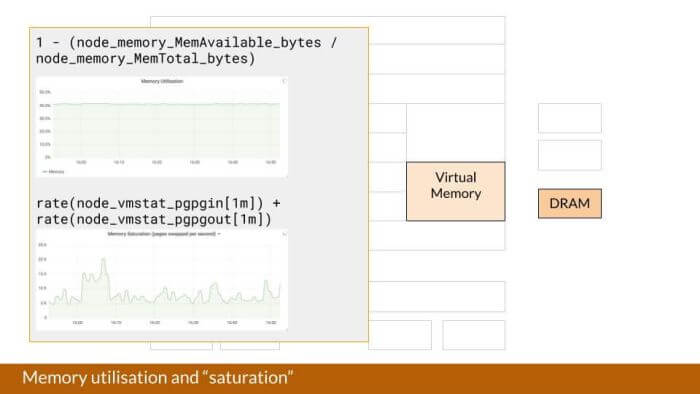
Memory utilization is measured by subtracting the fraction that’s free from 1, resulting in the used space. For saturation, Grafana Labs uses another proxy metric: pages swapped per second.
Disk Utilization
Disk utilization is tracked by IO time per second. “We have a lot of metrics that actually map to things that are given to you by iostat,” said Kaltschmidt. “The overlap there is quite big, and there’s an excellent article by Brian Brazil getting into which of the different fields that iostat gives you can be represented by metrics.”
To address the fear of disks getting full, “you can use Prometheus queries to set alerts to fire when you’re on a trajectory that your disk will become full,” said Kaltschmidt. For example, the alert in the slide below is set to fire when the available disk space is less than 40% available, and if the available space is trending to be zero in the next 24 hours, based on how it’s filling up over the last six hours. The drawback is that the condition has to be true for an hour; to cover situations when the disk may fill up in less than an hour, you need to combine this with other alert rules that track more aggressive disk-filling speeds and have those alerts routed to a paging service.
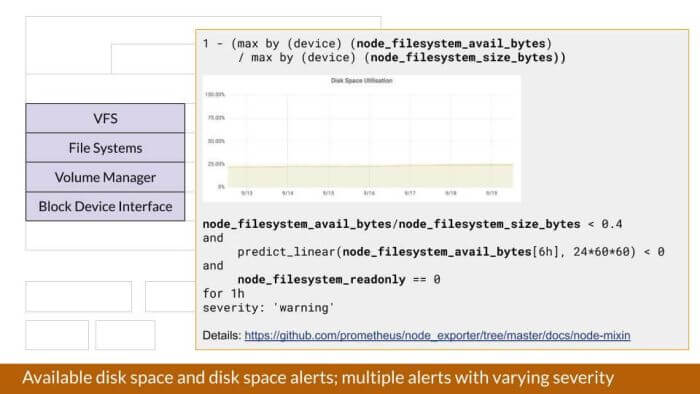
Many of these alerts are defined in the node mixin, which is a Jsonnet-based library of alerts and recording rules and dashboards. “Even if you don’t use Jsonnet in your organization, I think it’s still good to look at the alerting rules here,” Kaltschmidt said. “You can just copy them out, and if you think they can be improved, you can also open a GitHub issue on that same repo and then other people can benefit from your suggestions.”
Network Metrics
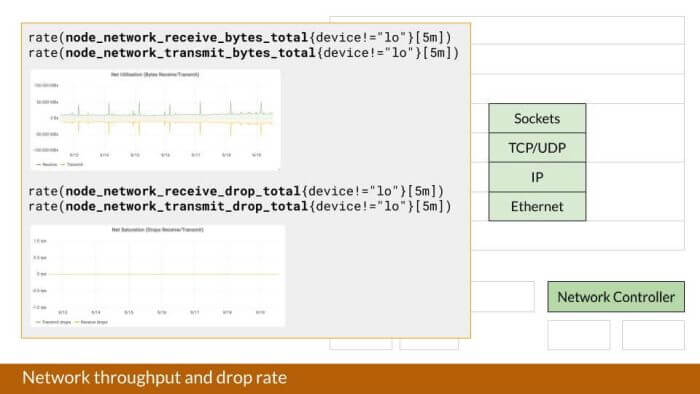
Grafana Labs uses some network metric queries that can be graphed using the negative y-axis for a convenient comparison of incoming vs. outgoing traffic.
Recently, some of Grafana Labs’ nodes running on GKE hit their conntrack limits and couldn’t establish any new connections. There hadn’t been an alert written for that circumstance, but Kaltschmidt demonstrated how a conntrack alert could have been quickly written in Grafana Explore.
(node_nf_conntrack_entries / node_nf_conntrack_entries_limit)
> 0.5
> 1.5 * scalar(avg(node_nf_conntrack_entries / node_nf_conntrack_entries_limit))
> (scalar(avg(node_nf_conntrack_entries / node_nf_conntrack_entries_limit)) + 2 * scalar(stddev(node_nf_conntrack_entries / node_nf_conntrack_entries_limit)))
Pro Tips
Kaltschmidt reminded the audience that it’s important to be aware of how many time series you produce when you run a node exporter. “It’s up to you then to figure out which collectors you want to enable to not have too many time series,” he said. “Some legacy collectors also run scripts or execute programs, and that puts additional burden on your system in terms of volume of time series."
To reduce the number of stored time series, he added, “you could write relabeling rules to just drop a couple of these, but maybe that’s a bit too tedious.”
One pro tip from Richard Hartmann is to run two node exporters on each machine, one with a minimal set and one with a full set of modules. “The stuff that’s regularly scraped is just contacting the node exporter process with the minimal set,” Kaltschmidt explained. “If they need to investigate a bit further or look at some things that you would otherwise have to log into the machine and look at the prod file system, you can then just go to the second node exporter that has the full set of modules and look at the metrics that are exposed there. I’m told that there’s a lot of savings to be had there.”
Björn Rabenstein, another Grafana Labs team member, recommends the textfile collector. “This adds little text snippets from files that are in a given directory to the exported metrics text that’s being scraped by your Prometheus,” said Kaltschmidt. “For example, if you have maintenance jobs like running backups or pushing out new updates of your system, you can track those by writing this little line, with information about when the last round was, and then you could create an alert that checks this timestamp and compares it to the time that’s now. If your backup hasn’t run in something like three days, you should probably alert.”
Another use case would be if you run a lot of your application software on bare metal, and in your entire fleet you have some features enabled on some machines but not on others. “It’s good to have a general overview over how many parts of your fleet have a certain feature enabled,” Kaltschmidt said. “A metric like my_feature_enabled set to 0 or 1 helps you track this.”
Kaltschmidt also suggested studying GitLab’s infrastructure-monitoring dashboards, which the company has made public.
How to Organize Everything
GitLab provides a good example of how to have a good general fleet overview. “They do a really nice thing in their general fleet overview, where on each row they have for example the CPU utilization and on a second row they have the load average, but they have grouped this in columns by the application tier,” said Kaltschmidt. “On the left you have the web workers, then you have the API, and then you have the git workers. And this is sort of in your head how GitLab is supposed to work. And here you can already see quite easily how busy each of these systems is right now. And I think this is really helpful for capacity planning, for example.”
Grafana Labs’ internal solution for monitoring the fleet is using the node exporter mixin, “because that gives us the dashboards right away as code, and that has a cluster dashboard as an aggregation of every node in a cluster,” said Kaltschmidt. “And then we have a template query-driven node dashboard, which basically just runs a node exporter build query, which then returns all your instance names. This is our way of service discovery or node discovery.”
Do you use any interesting alerting rules? Share them with us!

