The Future of Grafana's UI
The goal of Grafana has always been to help people feel in control of their observability infrastructure. Users come in with an alert; that takes them to a dashboard; they use ad hoc querying; and then they use log aggregation or distributed tracing to come up with a fix that will resolve an incident or issue.
“We assume that Grafana dashboards are designed by someone for a purpose, to solve a problem,” says David Kaltschmidt, Director of User Experience at Grafana Labs. “They created a dashboard as the solution to getting insight into a problem area, which means that these dashboards are generally meant to be immutable. If someone changes them, they are doing so for a reason and the changes are permanent and for the greater good.”
As Grafana evolves, we want to maintain our mission in creating a single UI to tie together the logs, metrics, and traces in an observability infrastructure, says Kaltschmidt. “We are looking at ways to make all of these elements more accessible and more interconnected.”
Here’s a look at how Grafana Labs is doing that now – and how we’re mapping out the possibilities for the future.
Grafana Today
People already have the ability to move between two out of the three pillars of observability within Grafana – logs and metrics. “The challenge is that as the pile of data gets bigger, we’ll have to give our users more power to eliminate the information they don’t need, yet maintain the necessary context that will help improve their troubleshooting ability,” says Kaltschmidt.
For example, most people have just one Grafana but, depending on the size of the company, there could be multiple metrics data sources.
“At Grafana Labs, we have a bunch of logging sources and a couple of metrics data sources. Early adopter customers will have similar situations,” says Kaltschmidt. “Then we have a really big customers that could, for example, use Grafana for graphing, Splunk for logging – which fits into the pluggable part of Grafana’s story – and Metrictank as a metric system. Or they may even have a homegrown ticketing system with a custom plugin.”
With some of the features Grafana 6.3 offers, “we can already help users optimize those individualized systems and multiple data sources,” says Kaltschmidt.
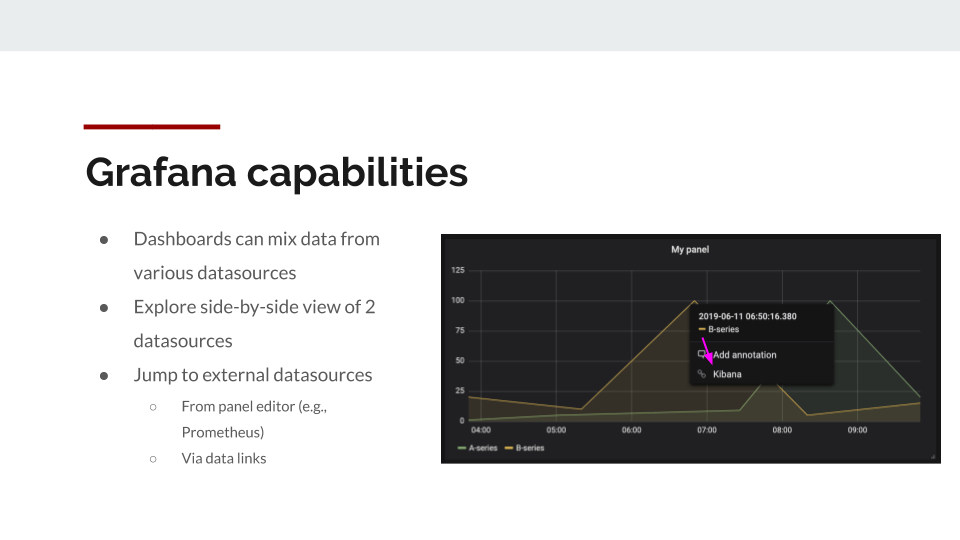
One of those features is data links, which you can configure to link out of from the hover of your dashboard data and take into account the data, the time series, the data x value, and the data y value so you can generate your cells dynamically. “Those links can jump from one system into another,” says Kaltschmidt.
Another capability we have to easily combine various systems is Explore. You can have a data source on the left and one on the right, and “they can be different,” explains Kaltschmidt. “You can combine metrics and metrics or metrics and logs.”
We also have our system of logic to keep query context while switching between datasources. One example is the query language translation between PromQL and LogQL, in which we keep the labeling to get the logs for the metrics that you were looking at.
Mixing More Data in Grafana
The next challenge, says Kaltschmidt, is “how can we take what we have and add some new capabilities to help get all these logs, traces, and metrics closer together?”
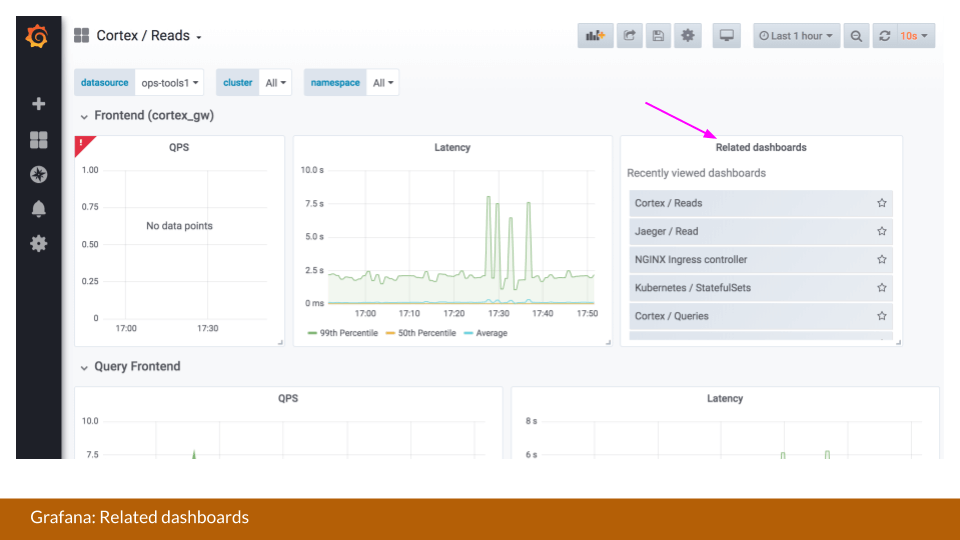
One feature Grafana is exploring is more intelligent dashboard suggestions. “For example, I thought it would be an interesting idea to chronologically suggest what people usually open next after viewing one dashboard,” says Kaltschmidt. “The goal would be to collect and provide internal analytics that can help you move seamlessly through your repeatable debugging story.”
“We could also be doing something with allowing the results of one query to be combined with the results of another,” says Kaltschmidt, who points out that this is an existing capability within Prom QL and Grafana also offers a metrics and logs combination. “But not every query language allows you to do this. So if you want to mix data from different sources, maybe we could do this on the Grafana side to give people even more power over the data.”
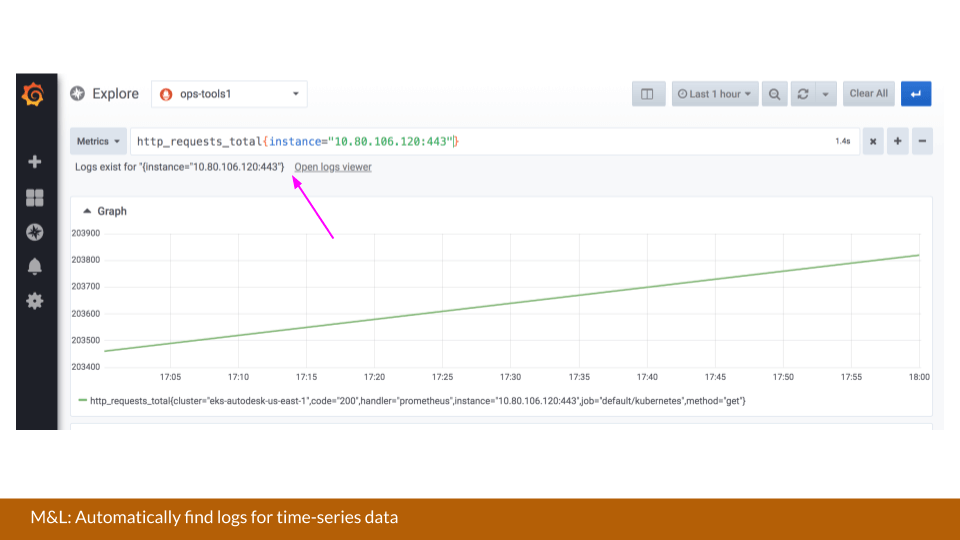
The holy grail remains in arching the pillars – in particular, to signal to the user that logs exist for a certain timeseries. One approach would be to give users the capability to launch a query that can determine when log data sources are configured. If logs exist for a particular selector, then it could bring users to the log service, taking the guesswork out of the query.
“We could even go further and have a histogram ready to give us an idea of how much log data is available,” says Kaltschmidt. “You might be able to see some spikes already or, by virtue of color, you can see there is an error cluster. You would then be able to pre-select time better, synchronizing between the logs and metrics.”
The same could be done for traces. “With metrics and traces for a particular label set or a tags set, we can launch a query to the traces service to give us an idea if traces will be available for this particular incident,” says Kaltschmidt.
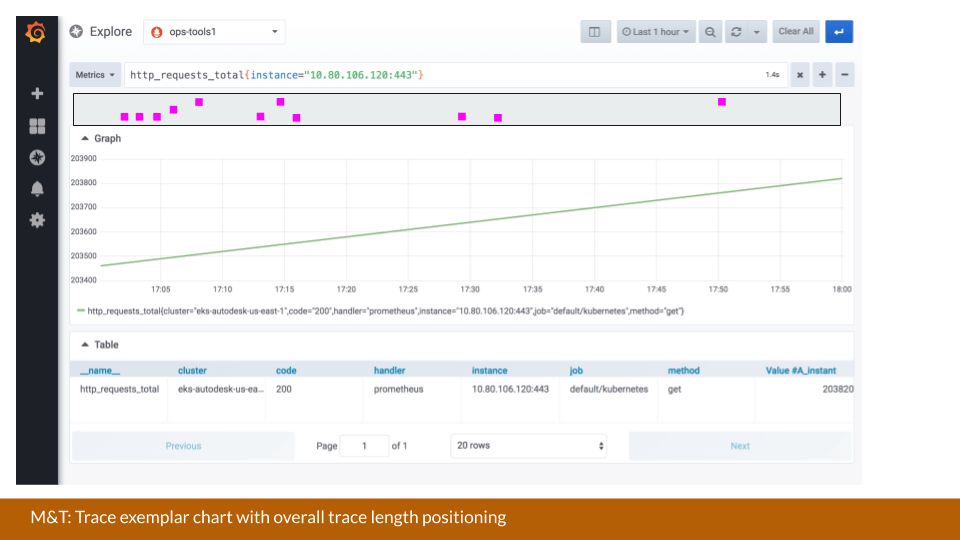
The information could then be overlaid, and “instead of having a histogram, we could make more use of the overall properties that a trace offers,” says Kaltschmidt. “For example, we could plot the trace’s time length on the y axis so we can see that this trace related to this instance took the longest.”
Introducing Exemplars & Modals
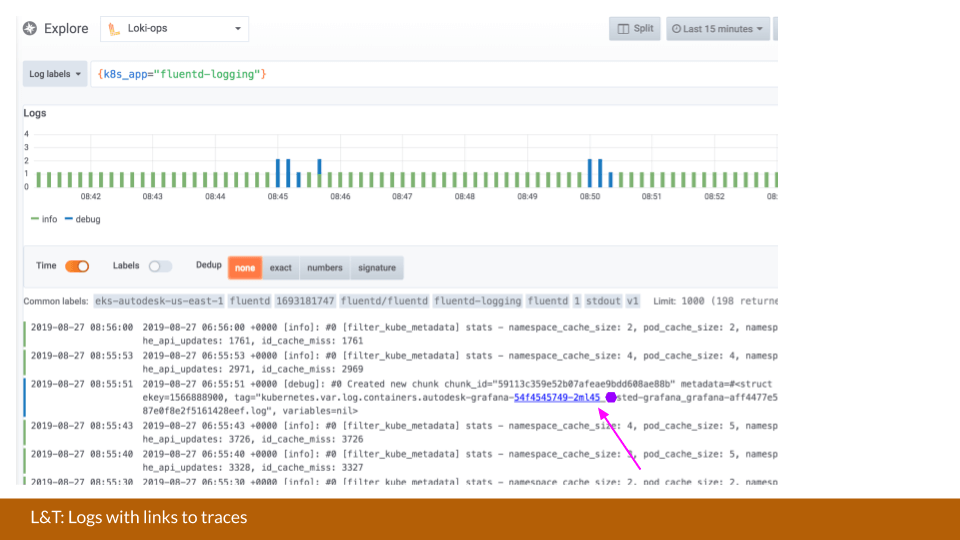
Another integration that Grafana is looking into with logs and traces would be something that’s based on the patterns in log messages. (A similar feature already exists between Elastic and Zipkin.) “This would mean that we integrate log line formators that expect to identify a pattern and turn that into links,” says Kaltschmidt. “This could be either internal, so it could jump to the upcoming internal trace viewer of Grafana. Or it could function like a data link that I referenced before, which can jump to any service that you run.”
Below is a demo of what exemplars in a heat map could look like within Grafana, where the exemplars are queried by the particular packet ranges in the heat map. Here, you have direct mapping from the bucket to the exemplars.
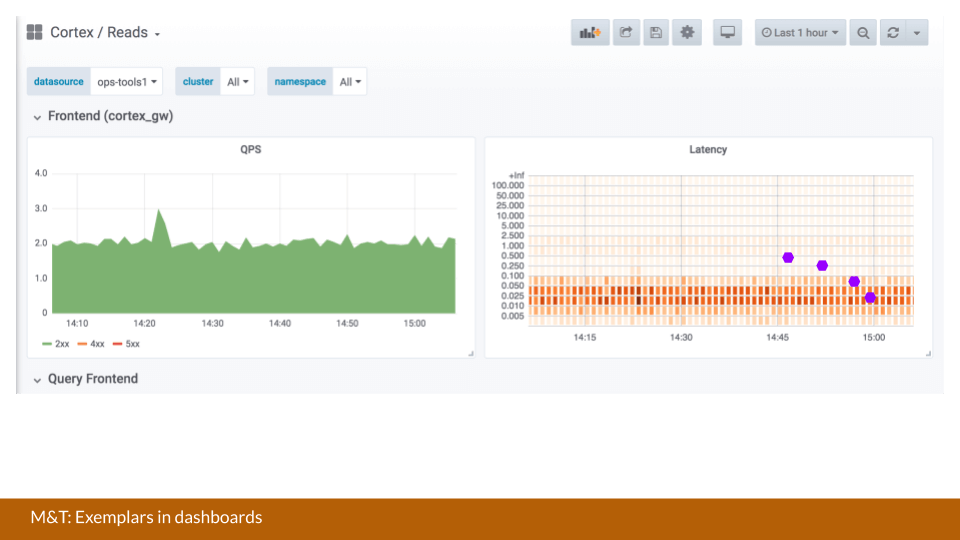
An idea on how to quickly review this data would be introducing modals to pull up a trace inside of Grafana so that users could then drill down on the data, says Kaltschmidt.
“This modal could also be extended to then also look for logs. So you get the metrics data, traces, and from there you can also jump to logs,” he says.
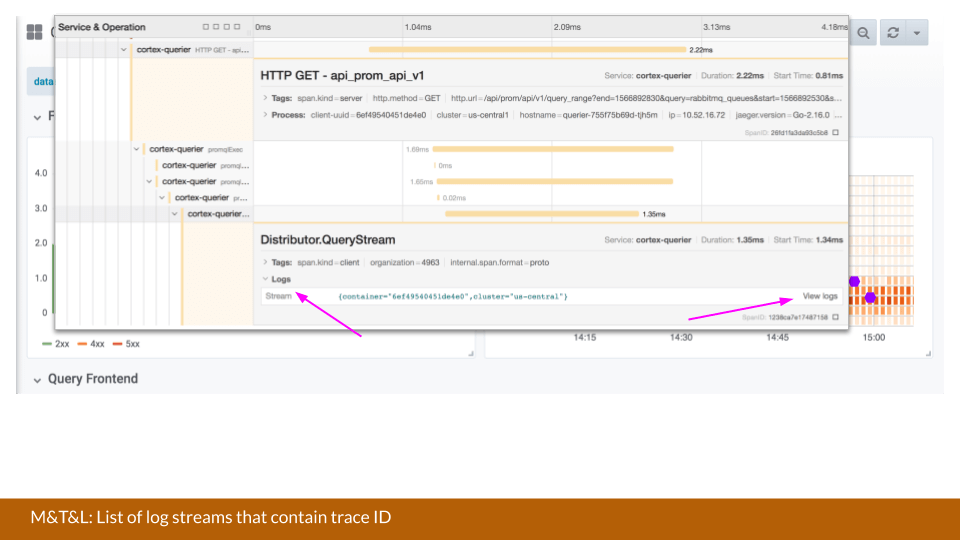
For logs, it’s almost the same, since certain labels are part of the trace. “The main idea there could be logic that would check for the availability of logs based on this set of labels,” says Kaltschmidt.
Then once you click on “view logs,” another modal comes over that one. “Then you’re full of modals, but you have the full picture now,” says Kaltschmidt. We’re still experimenting if a tabbed view like in an IDE would make for a nicer UX.
Implementing Tabs
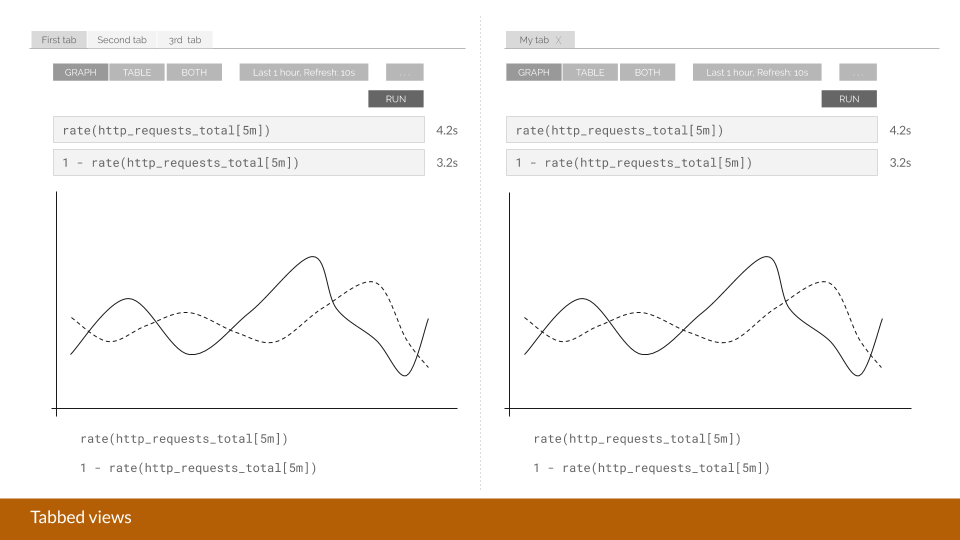
A major goal Kaltschmidt has is to transform Grafana into a troubleshooting IDE.
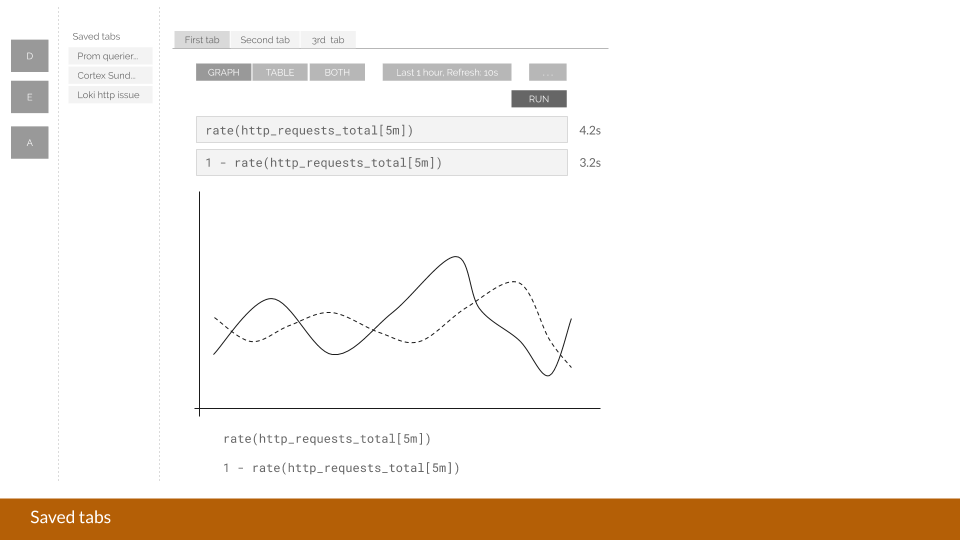
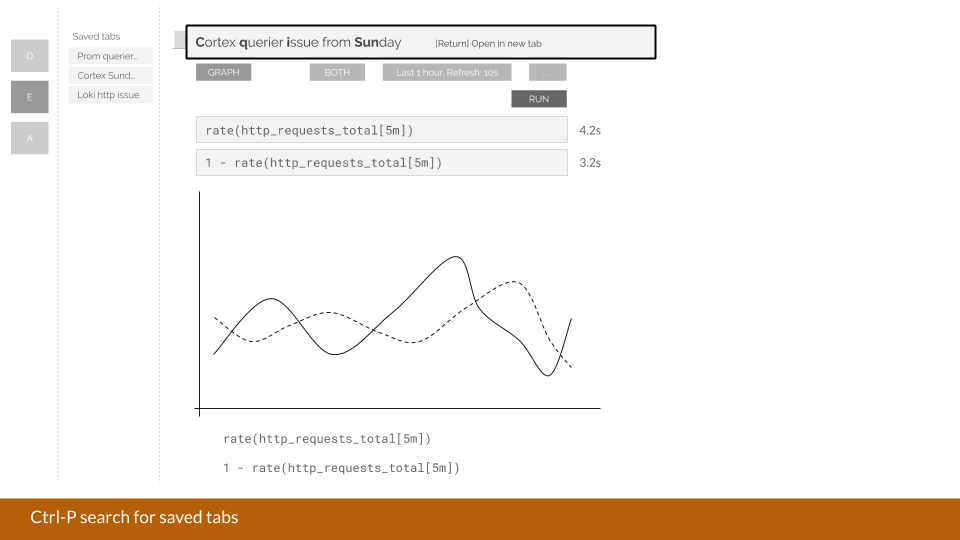
One way would be for Explore to not only offer a split view, but it could also introduce tabs. “You’re limited to only two panels right now, “says Kaltschmidt. “But the next step from this would be: Why shouldn’t I be able to also save a tab and give it a certain name? Then you can have a couple of Explore tabs open on the left and on the right to basically have data sources and queries ready that you want to compare with one another.”
Adding Comments
To make Grafana dashboards a bit more social, Kaltschmidt points out that the team could implement comments on the named tabs that are then centralized so anyone can reference them. Jupyter Notebook offers a similar UI, but Grafana could improve upon the idea because “after we’ve handled an incident, it would be great to have the capability to easily dump all of the pages I’ve been to, all the work I’ve done, and annotate it in one tab for the team to use in the future,” says Kaltschmidt.
“All of these are just ideas at this point,” Kaltschimdt says. “Some of these are a bit more aspirational than others.”
In the end, Kaltschmidt and the entire Grafana Labs team ensures one thing never changes. “The Grafana dashboard will always be a single pane of glass that allows you to collect a lot of data,” he says. “We are simply trying to evolve the product and services to help bring your logs, traces, and metrics closer together.”

