New in Grafana 6.3: Easy-to-Use Data Links
At Grafana Labs, we constantly look for new opportunities to enhance workflows for our users. Our mission is for Grafana to be the missing piece in your system and a link between the three pillars of observability. No matter what your observability stack is composed of, we want Grafana to be the answer for bridging the gaps between metrics, logs, and traces.
Even though we are opinionated about the LGTM stack that we introduced at GrafanaCon 2019, we understand that our users’ data can be stored and accessed via external systems that Grafana does not support.
Up until Grafana 6.3, Drilldown links enabled navigation between Grafana dashboards and external systems. But if metrics were visualized in Grafana and logs in, let’s say, Kibana, the interaction between those two systems was very limited, and a lot of real-life use cases were not supported. The tricky part is taking the context of what you are looking at in Grafana and recreating it in the external system.
Thanks to our collaboration with Bloomberg and feedback from our Grafana community, we are happy to announce that Grafana 6.3 introduces a new, simpler, and more advanced way to drill down through your data.
First, we changed the name from Drilldown links to Panel links and we have significantly simplified and improved the way you edit a link:
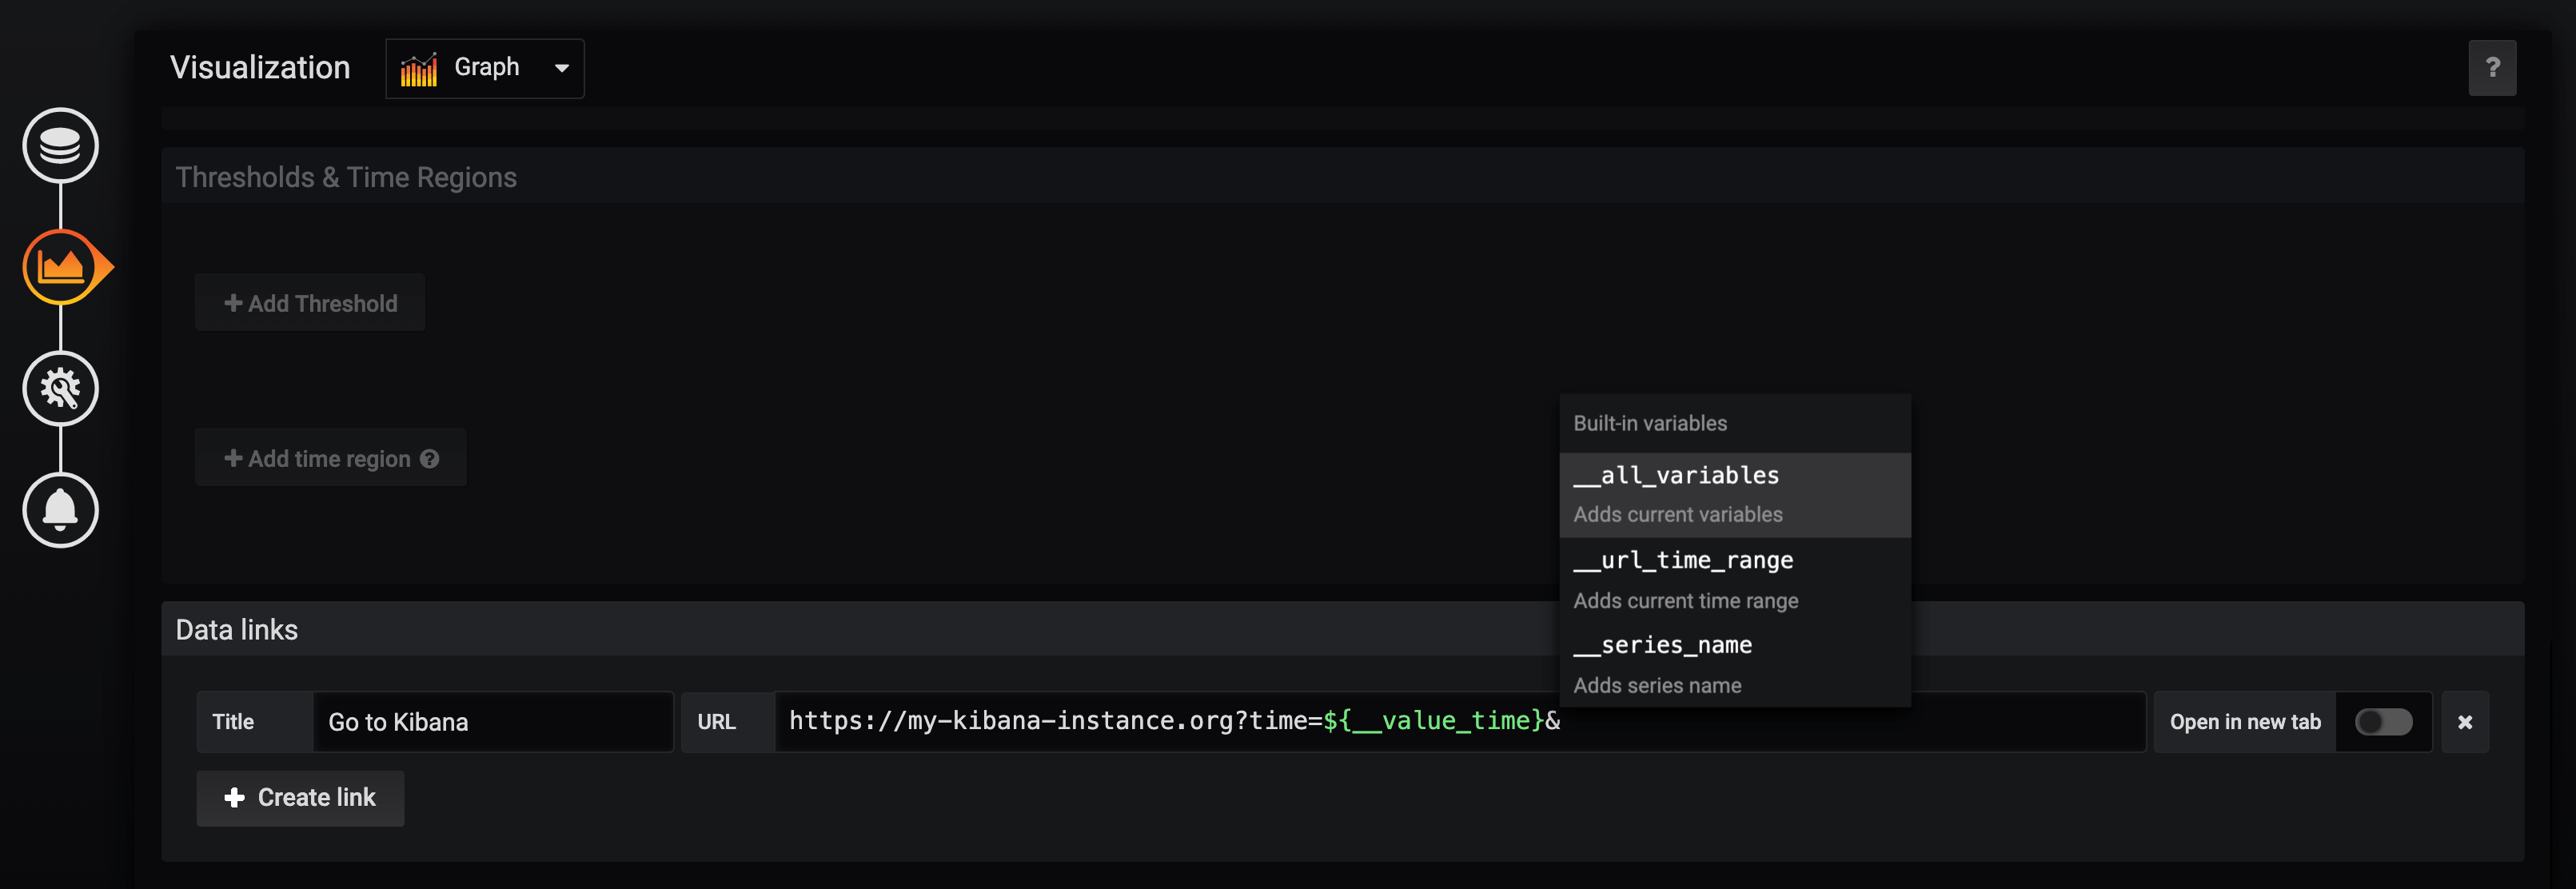
In addition, for the Graph panel, we have introduced Data links. The difference between those two types of links lies in the variables that can be used when building a link.
Data links, used in the actual visualization, have access not only to template variables and current time range, but also to variables that are specific to the series which you interact with such as series name or clicked datapoint timestamp. Being able to choose a datapoint and combine its values as well as the series name should be enough to recreate the context in the external system. (You can read more about all available variables in the documentation.)
Last, but not least, we have introduced a new way of accessing Data links from the visualization. All the Data links you create are now available via a context menu in the Graph panel that’s shown when you click on a single data point:

In future versions of Grafana, we plan to enable Data links in visualizations other than line graphs, add Data links to the visualization legend, and make more series-specific variables available via Data link variables (i.e. tags/labels for data sources that support those).
As always at Grafana Labs, we have been experimenting with multiple approaches on how to tackle the problem of cross-system interaction from within Grafana dashboards. You can read more on that in the original design doc.
Follow our blog and Twitter for the latest updates on Grafana’s Data link improvements!

