Homelab Security with OSSEC, Loki, Prometheus, and Grafana on a Raspberry Pi
For many years I have been using an application called OSSEC for monitoring my home network. The output of the application is primarily email alerts which are perfect for seeing events in near real-time. In this post, I’ll be showing you how to build a good high-level view of these alerts over time with Loki, Prometheus, and Grafana.
In other words, no more logging in via ssh and combing through logs to search or view alerts!
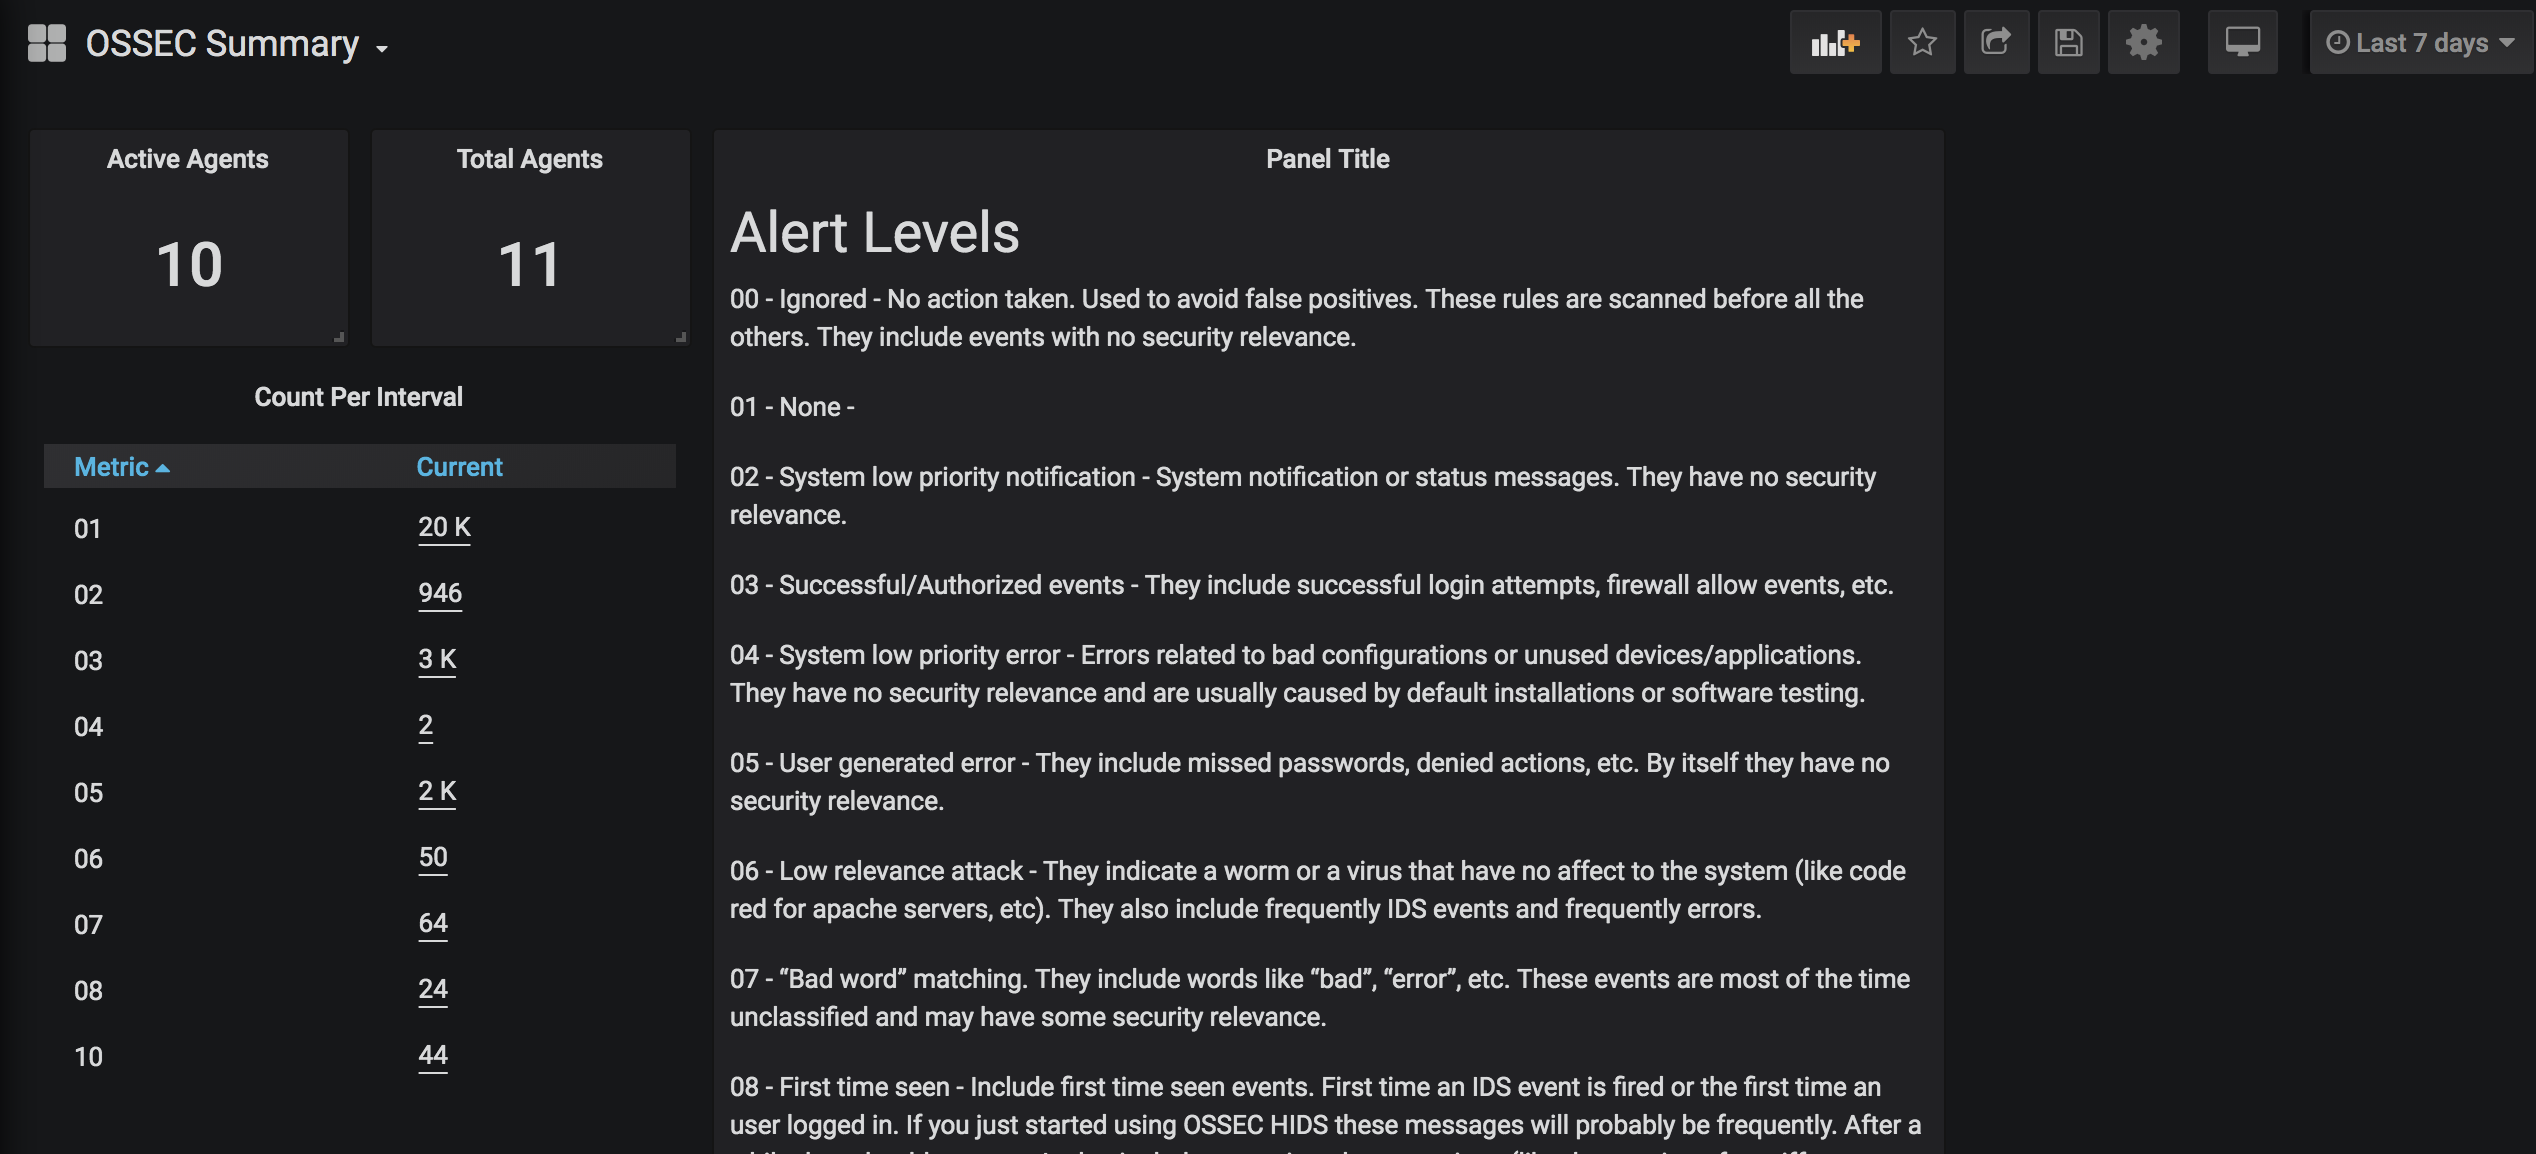
Here are a few examples:


Setup
There are a few moving parts to this setup, and I’ll work through the setup of each. But to start, you need a Raspberry Pi running the Raspbian OS. (I use the minimal install without a UI to save some resources.) If you have a lot of hosts, you will probably want one of the newer 3B+ or 4 models. I have about 15 hosts on my network and am running on an older model 2B (which is quad core with 1GB of RAM) and so far things are working fine. RAM appears to be the tight resource and getting ahold of one of the newer model 4 Raspberry Pi’s with 4GB of RAM might be a good idea.
Disclaimer:
This project was a chance for me to play around with Loki while solving a fun problem. This is not production quality stuff here. I’m going to be running everything from the pi users home directory /home/pi, rather than more appropriate directories like /usr/bin, /srv, /var/run etc. Additionally, my directory structure isn’t entirely consistent: Grafana and Prometheus are being extracted into versioned directories and Loki/Promtail are not, as such upgrading components will be a little tedious. If you are going to consider this system for your business, please take the time to put things where they belong and use the appropriate flags for setting data directories, etc.
OSSEC
Here is a very basic OSSEC install for those not familiar. I am using the install script which will compile OSSEC from source.
Raspbian should already have installed the build-essentials package, which includes a compiler. Unfortunately the docs for OSSEC are not up to date with version 3.3.0, which requires an additional step of downloading PCRE. (There is also a way to do this with system packages, but I had trouble finding the right package on Raspbian.) See this issue for more info.
wget https://github.com/ossec/ossec-hids/archive/3.3.0.tar.gz
tar -zxvf 3.3.0.tar.gz
wget https://ftp.pcre.org/pub/pcre/pcre2-10.32.tar.gz
tar -xzf pcre2-10.32.tar.gz -C ossec-hids-3.3.0/src/external
cd ossec-hids-3.3.0/
sudo ./install.sh
Follow the prompts; you will want to choose the server type.
After OSSEC is installed, you will need to modify the config to enable the JSON output. Because all of OSSEC’s files are owned as root, it will be easier to change to the root user.
sudo su -Edit /var/ossec/etc/ossec.conf in the <global> section. You will want to add <jsonout_output>yes</jsonout_output>:
<ossec_config>
  <global>
    <email_notification>yes</email_notification>
    <email_to>email@email.com</email_to>
    <smtp_server>127.0.0.1</smtp_server>
    <email_from>ossecm@email.com</email_from>
    <jsonout_output>yes</jsonout_output>
  </global>
...
Note: Those are not valid email configs. You will need this to be valid for your setup if you want to receive email.
Now you can (re)start OSSEC:
/var/ossec/bin/ossec-control restartYou can poke around in the /var/ossec directory and look at /var/ossec/logs/ossec.log to see if OSSEC is running without issues. Also you can look at /var/ossec/logs/alerts/alerts.json and hopefully see alert entries.
For a better setup, you’ll want to start configuring OSSEC agents on your other computers. That’s outside the scope of this post, but the processes are basically the same as installing the server: Download the OSSEC tar.gz on your agent machine, and choose agent when running the install script. Some distros (including Windows) may have pre-built binaries or packages you can use. See the OSSEC downloads page for more info.
Promtail
With OSSEC installed, it’s time to start adding our components. We’ll start with Promtail:
cd
mkdir promtail
cd promtail
wget https://github.com/grafana/loki/releases/download/v0.3.0/promtail_linux_arm.gz
gunzip promtail_linux_arm.gz
chmod +x promtail_linux_arm
Next, we need to make a config file. With your editor of choice, create promtail.yml in the same directory:
server:
  http_listen_port: 8080
  grpc_listen_port: 0

positions:
  filename: /var/ossec/logs/alerts/promtail_positions.yaml

clients:
  - url: http://localhost:3100/api/prom/push

scrape_configs:
- job_name: ossec_alerts
  pipeline_stages:
  - json:
      expressions:
        # Extract the timestamp, level, group, and host from the JSON into the extracted map
        timestamp: TimeStamp
        level: rule.level
        group: rule.group
        host: hostname
  - regex:
      # The host is wrapped in parens, extract just the string and essentially strip the parens
      source: host
      expression: '^\((?P<host>\S+)\)'
  - template:
      # Pad the level with leading zeros so that grafana will sort the levels in increasing order
      source: level
      template: '{{ printf "%02s" .Value }}'
  - labels:
      # Set labels for level, group, and host
      level: ''
      group: ''
      host: ''
  - timestamp:
      # Set the timestamp
      source: timestamp
      format: UnixMs
  - metrics:
      # Export a metric of alerts, it will use the labels set above
      ossec_alerts_total:
        type: Counter
        description: count of alerts
        source: level
        config:
          action: inc
  static_configs:
  - targets:
      - localhost
    labels:
      job: ossec
      type: alert
      __path__: /var/ossec/logs/alerts/alerts.json
- job_name: ossec_firewall
  pipeline_stages:
  - regex:
      # The firewall log is not JSON, this regex will match all the parts and extract the groups into extracted data
      expression: '(?P<timestamp>\d{4} \w{3} \d{2} \d{2}:\d{2}:\d{2}) (?P<host>\S+) {0,1}\S{0,} (?P<action>\w+) (?P<protocol>\w+) (?P<src>[\d.:]+)->(?P<dest>[\d.:]+)'
  - regex:
      # This will match host entries that are wrapped in parens and strip the parens
      source: host
      expression: '^\((?P<host>\S+)\)'
  - regex:
      # Some hosts are in the format `ossec -> ...` this will match those and only return the host name
      source: host
      expression: '^(?P<host>\S+)->'
  - template:
      # Force the action (DROP or ALLOW) to lowercase
      source: action
      template: '{{ .Value | ToLower }}'
  - template:
      # Force the protocol to lowercase
      source: protocol
      template: '{{ .Value | ToLower }}'
  - labels:
      # Set labels for action, protocol, and host
      action: ''
      protocol: ''
      host: ''
  - timestamp:
      # Set the timestamp, we have to force the timezone because it doesn't exist in the log timestamp, update this for your servers timezone
      source: timestamp
      format: '2006 Jan 02 15:04:05'
      location: 'America/New_York'
  - metrics:
      # Export a metric of firewall events, it will use the labels set above
      ossec_firewall_total:
        type: Counter
        description: count of firewall events
        source: action
        config:
          action: inc
  static_configs:
  - targets:
      - localhost
    labels:
      job: ossec
      type: firewall
      __path__: /var/ossec/logs/firewall/firewall.log
This config will tail the JSON alerts log and non-JSON firewall log, setting some useful labels for querying and exporting metrics for Prometheus to scrape.
To make sure Promtail always runs on reboot, we will also setup a systemd service and create a file in the same directory called promtail.service:
[Unit]
Description=Promtail Loki Agent
After=loki.service

[Service]
Type=simple
User=root
ExecStart=/home/pi/promtail/promtail
WorkingDirectory=/home/pi/promtail/
Restart=always
RestartSec=10

[Install]
WantedBy=multi-user.target
Copy the file (systemd won’t allow us to symlink; when we enable the service, systemd won’t follow symlinks):
sudo cp /home/pi/promtail/promtail.service /etc/systemd/system/promtail.serviceLoki
Very similar to Promtail, we will download and setup Loki:
cd
mkdir loki
cd loki
wget https://github.com/grafana/loki/releases/download/v0.3.0/loki_linux_arm.gz
gunzip loki_linux_arm.gz
chmod +x loki_linux_arm
Now we make the Loki config file in the same directory loki-config.yaml:
auth_enabled: false

server:
  http_listen_port: 3100

ingester:
  lifecycler:
    address: 127.0.0.1
    ring:
      kvstore:
        store: inmemory
      replication_factor: 1
    final_sleep: 0s
  chunk_idle_period: 1m
  chunk_retain_period: 30s

schema_config:
  configs:
  - from: 2018-04-15
    store: boltdb
    object_store: filesystem
    schema: v9
    index:
      prefix: index_
      period: 168h

storage_config:
  boltdb:
    directory: /home/pi/loki/index

  filesystem:
    directory: /home/pi/loki/chunks

limits_config:
  enforce_metric_name: false
  reject_old_samples: true
  reject_old_samples_max_age: 168h

chunk_store_config:
  max_look_back_period: 0

table_manager:
  chunk_tables_provisioning:
    inactive_read_throughput: 0
    inactive_write_throughput: 0
    provisioned_read_throughput: 0
    provisioned_write_throughput: 0
  index_tables_provisioning:
    inactive_read_throughput: 0
    inactive_write_throughput: 0
    provisioned_read_throughput: 0
    provisioned_write_throughput: 0
  retention_deletes_enabled: true
  retention_period: 720h
This config specifies a 30-day retention on logs. You can change retention_period if you want this to be longer or shorter.
We will also want to create a systemd service for Loki:
[Unit]
Description=Loki Log Aggregator
After=network.target

[Service]
Type=simple
User=pi
ExecStart=/home/pi/loki/loki_linux_arm -config.file loki-config.yaml
WorkingDirectory=/home/pi/loki/
Restart=always
RestartSec=10

[Install]
WantedBy=multi-user.target
And then copy the file:
sudo cp /home/pi/loki/loki.service /etc/systemd/system/loki.servicePrometheus
cd
wget https://github.com/prometheus/prometheus/releases/download/v2.11.1/prometheus-2.11.1.linux-armv7.tar.gz
tar -zxvf prometheus-2.11.1.linux-armv7.tar.gz
For Prometheus, we will edit the existing prometheus.yml file and make it look like this:
# my global config
global:
  scrape_interval:     15s # Set the scrape interval to every 15 seconds. Default is every 1 minute.
  evaluation_interval: 15s # Evaluate rules every 15 seconds. The default is every 1 minute.
  # scrape_timeout is set to the global default (10s).

# Alertmanager configuration
alerting:
  alertmanagers:
  - static_configs:
    - targets:
      # - alertmanager:9093

# Load rules once and periodically evaluate them according to the global 'evaluation_interval'.
rule_files:
  # - "first_rules.yml"
  # - "second_rules.yml"

# A scrape configuration containing exactly one endpoint to scrape:
# Here it's Prometheus itself.
scrape_configs:
  # The job name is added as a label `job=<job_name>` to any timeseries scraped from this config.
  - job_name: 'prometheus'

    # metrics_path defaults to '/metrics'
    # scheme defaults to 'http'.

    static_configs:
    - targets: ['localhost:9090']
  - job_name: 'ossec'
    static_configs:
    - targets: ['localhost:8080']
  - job_name: 'ossec-metrics'
    static_configs:
    - targets: ['localhost:7070']
  - job_name: 'loki'
    static_configs:
    - targets: ['localhost:3100']
Really the only change here is the three additional scrape configs at the bottom.
Like the others, we will create a systemd service for it; however, because I am running Prometheus out of the extracted (and versioned) directory, I made a separate directory to hold the service file:
cd
mkdir prometheus
cd prometheus
Edit prometheus.service and give it the following contents:
[Unit]
Description=Prometheus Metrics
After=network.target

[Service]
Type=simple
User=pi
ExecStart=/home/pi/prometheus-2.11.1.linux-armv7/prometheus --storage.tsdb.retention.time=30d
WorkingDirectory=/home/pi/prometheus-2.11.1.linux-armv7/
Restart=always
RestartSec=10

[Install]
WantedBy=multi-user.target
Copy the file:
sudo cp /home/pi/prometheus/prometheus.service /etc/systemd/system/prometheus.serviceGrafana
cd
wget https://dl.grafana.com/oss/release/grafana-6.3.3.linux-armv7.tar.gz
tar -zxvf grafana-6.3.3.linux-armv7.tar.gz
I didn’t modify the Grafana config. All I did was make the systemd service. Like Prometheus, this will be put in its own directory:
cd
mdkir grafana
cd grafana
Create the grafana.service file with these contents:
[Unit]
Description=Grafana UI
After=network.target

[Service]
Type=simple
User=pi
ExecStart=/home/pi/grafana-6.3.3/bin/grafana-server
WorkingDirectory=/home/pi/grafana-6.3.3/
Restart=always
RestartSec=10

[Install]
WantedBy=multi-user.target
Copy the file:
sudo cp /home/pi/grafana/grafana.service /etc/systemd/system/grafana.serviceOSSEC-metrics
I also wanted my dashboards to show me the number of agents that are connected vs. disconnected. This wasn’t something I was able to do from just tailing the OSSEC output logs so I built a simple app to execute some OSSEC commands and parse the output called ossec-metrics. Setup for this is the same as the others:
cd
mkdir ossec-metrics
cd ossec-metrics
wget https://github.com/slim-bean/ossec-metrics/releases/download/v0.1.0/ossec-metrics-linux-armv7.gz
gunzip ossec-metrics-linux-armv7.gz
chmod +x ossec-metrics-linux-armv7
There is no config. All we need to do is make the systemd service by creating the file ossec-metrics.service in the same directory with these contents:
[Unit]
Description=Ossec Metrics exposes OSSEC info for prometheus to scrape
After=network.target

[Service]
Type=simple
User=root
ExecStart=/home/pi/ossec-metrics/ossec-metrics-linux-armv7
WorkingDirectory=/home/pi/ossec-metrics/
Restart=always
RestartSec=10

[Install]
WantedBy=multi-user.target
Copy the file:
sudo cp /home/pi/ossec-metrics/ossec-metrics.service /etc/systemd/system/ossec-metrics.serviceOperation
With everything setup, it’s time to start our services. First, we’ll need to reload systemd to detect the new service files:
sudo systemctl daemon-reloadThen I suggest starting each service one at a time and checking the output for errors:
sudo systemctl start prometheus
sudo systemctl status prometheus
If everything is working, you will see the following in the output as well as some recent logs:
Active: active (running) since Thu 2019-08-22 08:54:03 EDT; 2h 10min agoIf the service has failed, you can look at the output from status and also look in /var/log/syslog for more information.
Assuming everything is okay, continue starting the other services.
sudo systemctl start loki
sudo systemctl status loki
sudo systemctl start promtail
sudo systemctl status promtail
sudo systemctl start ossec-metrics
sudo systemctl status ossec-metrics
sudo systemctl start grafana
sudo systemctl status grafana
And with everything working, you can then enable all the services to start on boot:
sudo systemctl enable prometheus
sudo systemctl enable loki
sudo systemctl enable promtail
sudo systemctl enable ossec-metrics
sudo systemctl enable grafana
Dashboards
All this work, and we are finally at the step where you can see some pay off!
In a web browser, you want to navigate to the IP address of your Raspberry Pi http://192.168.1.100:3000
Note: Your IP address will likely be something different; however, make sure to add the :3000 port!
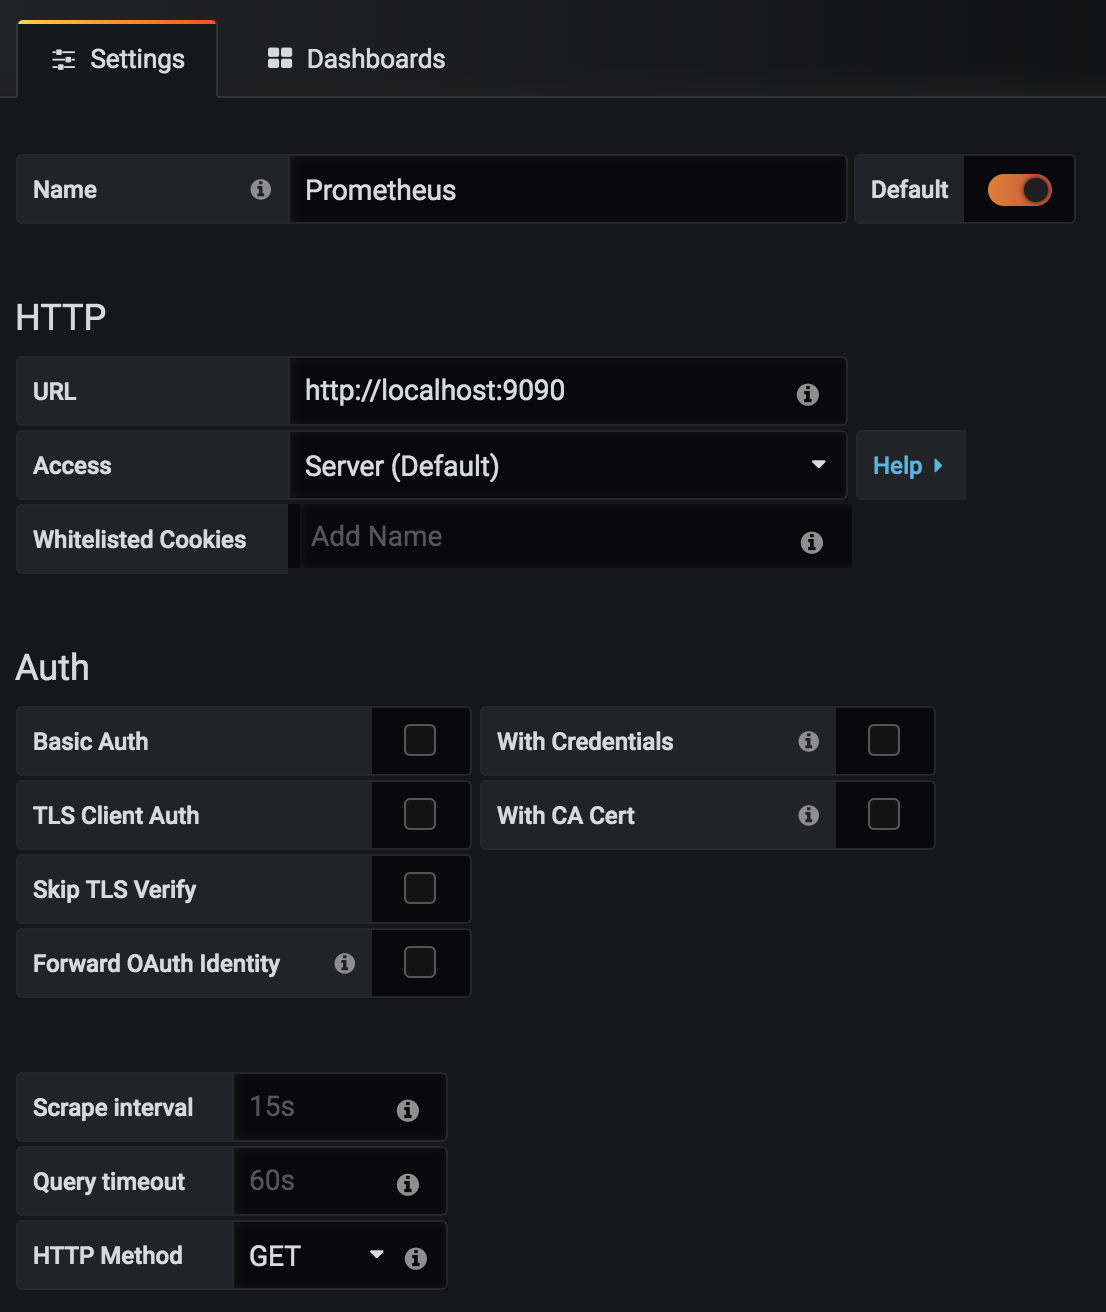
Log into Grafana and add two new datasources. First a Prometheus datasource:

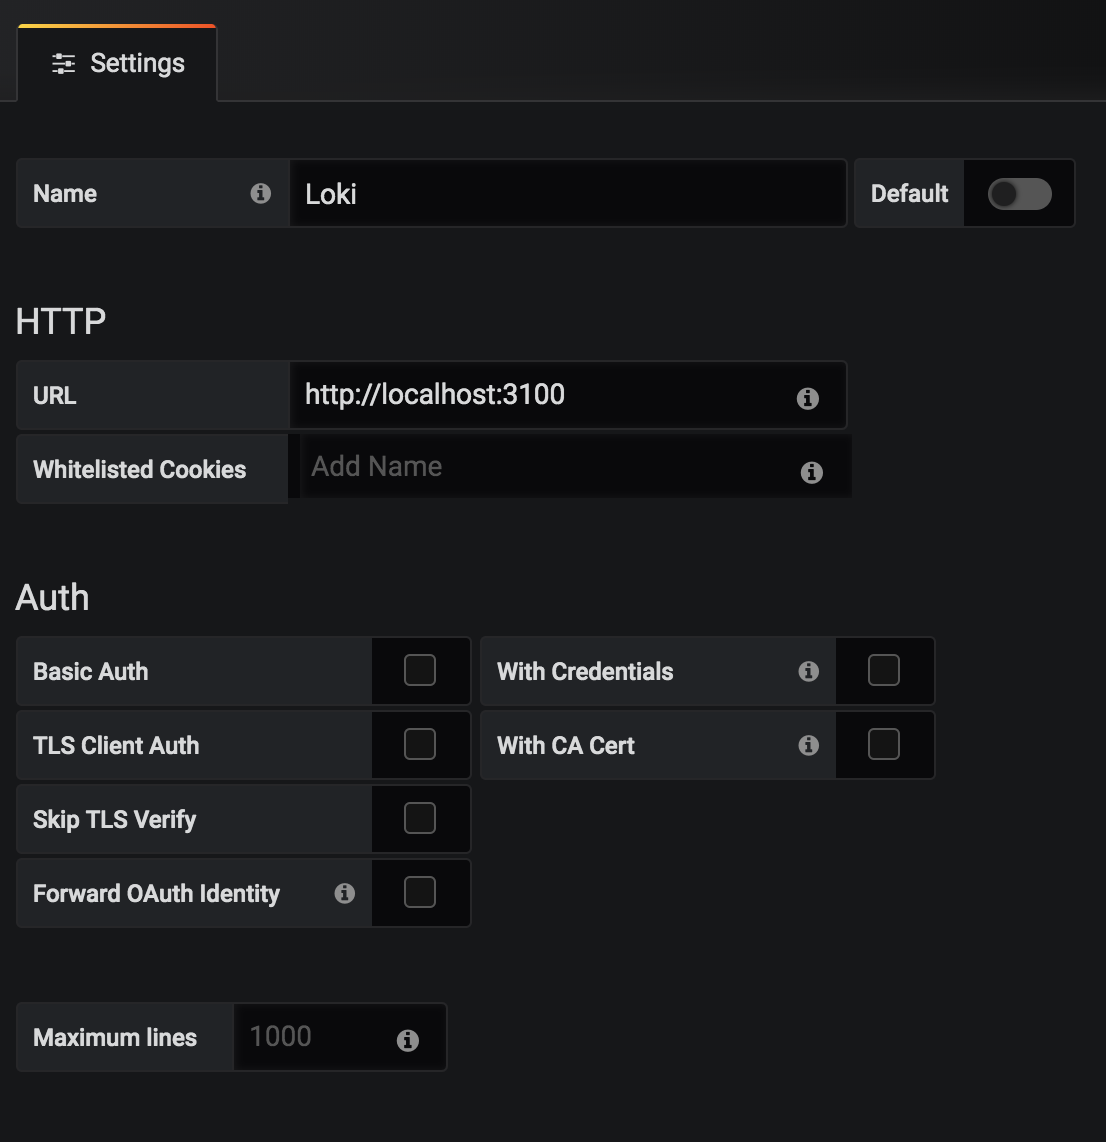
Then a Loki datasource:

Now you can import the two dashboards I created by hovering over the + symbol on the left panel and selecting Import.
For the OSSEC Trends dashboard, paste this JSON and load and save the dashboard.
For the OSSEC Summary dashboard, repeat by going to the + and Import, pasting this JSON.
Conclusion
Hopefully now you, too, can have your own OSSEC server with nice visuals and easy access to historical events running on an inexpensive Raspberry Pi!
Of course you need not run this on a Raspberry Pi, and with the scalability of Loki, the sky is the limit for the number of events you can store.

