

New in Grafana v6.3: Introducing Loki's Log Row Context Viewer
With the release of Grafana v6.3, we are introducing a significant improvement to Loki’s log exploration workflow in Grafana Explore.
Launched at KubeCon North America last December, Loki is a Prometheus-inspired service that optimizes storage, search, and aggregation while making logs easy to explore natively in Grafana. Loki is designed to work easily both as microservices and as monoliths, and correlates logs and metrics to save users money.
Less than a year later, Loki has almost 6,500 stars on GitHub and is now quickly approaching GA.
Loki is tightly integrated into Grafana Explore, which allows you to correlate metrics and logs by viewing them side-by-side for a more seamless debugging workflow.
Imagine investigating your logs against a particular error that occurred in your application. Typically you would do that by using Loki’s filter expression which will narrow down the results to only those log lines that match the provided search expression, i.e.:
{filename="var/log/grafana/grafana.log"} Alert Rule Result Error
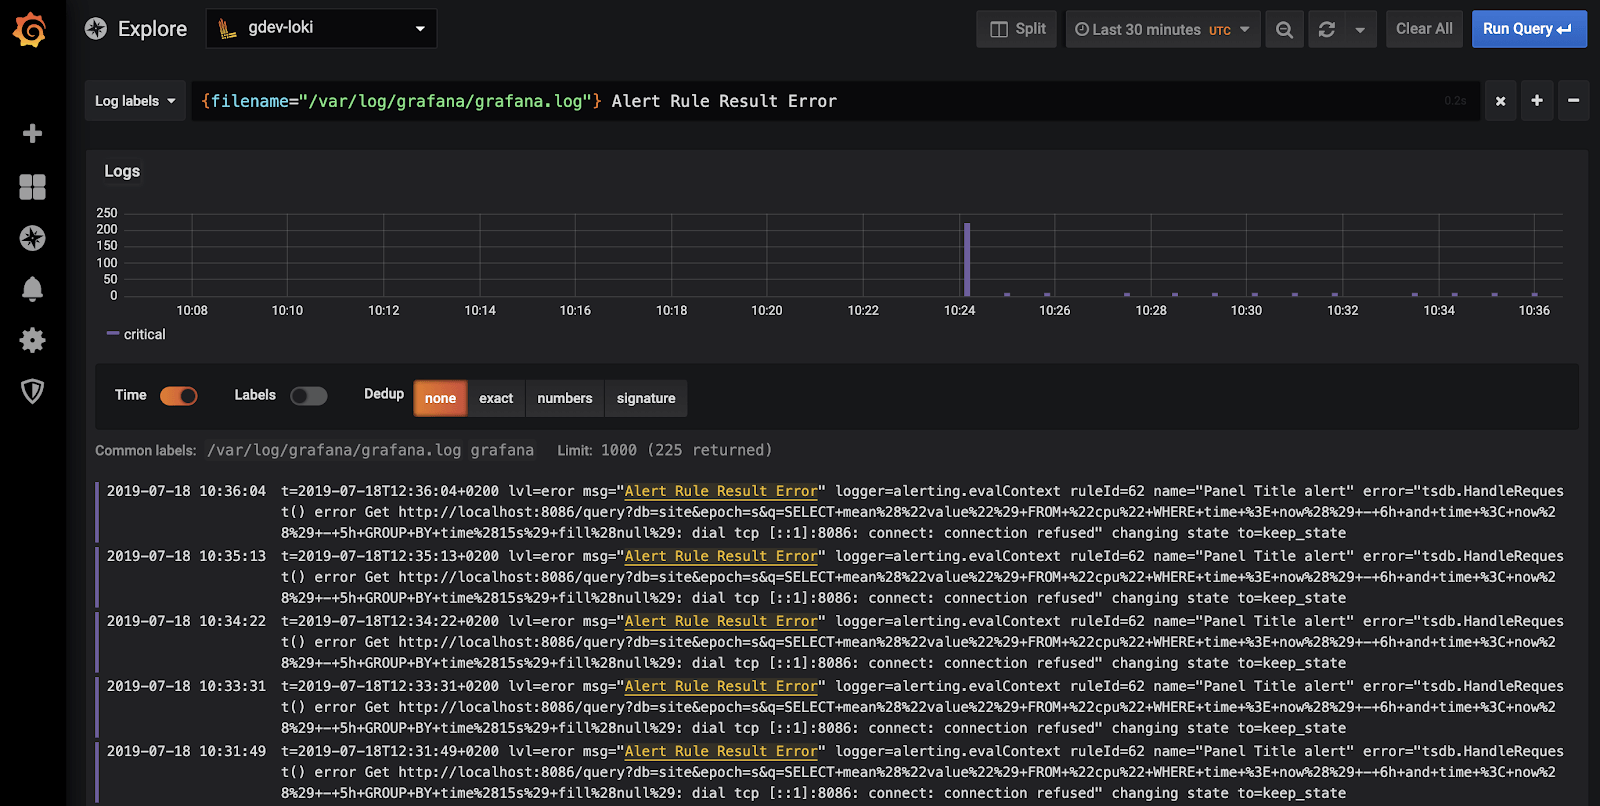
But, as you can see in the image above, you are losing the important information about the logs that appeared just before and after the error occurred. In many cases, this context can be vital to understanding the circumstances in which the error happened, especially when you’re on call because the hidden log rows could have more information about the underlying causes of the alert.
With the new log row context feature in Grafana Explore, reviewing the filtered out log lines becomes as simple as a click on a newly introduced “Show Context” button. The button appears when you hover over a log line in Explore:

When clicking on it, a log row context viewer will be shown that will display the surrounding logs of the log line you are investigating:
Note that the context feature is only available on log results that were returned for a query with a search term (filter expression). Also keep in mind that the query used for the context is based on the same label set as the original query. For example, if you are trying to view logs from more hosts, you need to remove any host labels from the selector part of the query.
We hope this will improve the debugging workflow for those using Grafana Explore and we appreciate any feedback around this new feature.
