Loki’s Path to GA: Loki-Canary Early Detection for Missing Logs
Launched at KubeCon North America last December, Loki is a Prometheus-inspired service that optimizes storage, search, and aggregation while making logs easy to explore natively in Grafana. Loki is designed to work easily both as microservices and as monoliths, and correlates logs and metrics to save users money.
Less than a year later, Loki has almost 6,500 stars on GitHub and is now quickly approaching GA. At Grafana Labs, we’ve been working hard on developing key features to make that possible. In the coming weeks, we’ll be highlighting some of these features. This post will focus on the loki-canary project.
While developing and testing Loki, we are constantly rolling out new versions. From time to time there are issues with rollouts or warning and error messages in the logs, and we found it wasn’t always clear if a rollout was seamless or if data was potentially lost.
It became apparent we needed a way to be quickly notified if logs were not making it from our applications into Loki – in other words, an end-to-end black box test that would run all the time and let us know right away if things were amiss. Borrowing from the old adage “canary in a coal mine,” the loki-canary was born: an early detection mechanism for missing logs in Loki.
The operation is fairly straightforward; loki-canary writes logs at a configurable interval with a configurable size, and those logs are read by promtail and sent to Loki. At the same time, loki-canary opens a websocket connection to Loki and live tails for the logs it wrote. Loki-canary produces a series of metrics which are then scraped and can be alerted on by Prometheus. Those metrics include counters for any logs that are missing, out of order, or duplicated. Also, by comparing the timestamp the canary put in the log, we create a histogram of the response time from when the log was created to when it was received over the websocket.
During our initial deployments of the canary, we found that logs can be missed on websocket connections when they are disconnected, which often happens during a rollout as the server they are connected to is replaced. So we added a little more functionality to directly query for logs that went missing over the websocket connection and then report them as missing from the websocket, and/or also missing from Loki entirely.
Now, we have several hundred canaries throughout our clusters happily chirping millions of little logs every day, letting us know if something has gone wrong. Thankfully our canaries are digital and need not sacrifice their lives to warn us of missing logs.
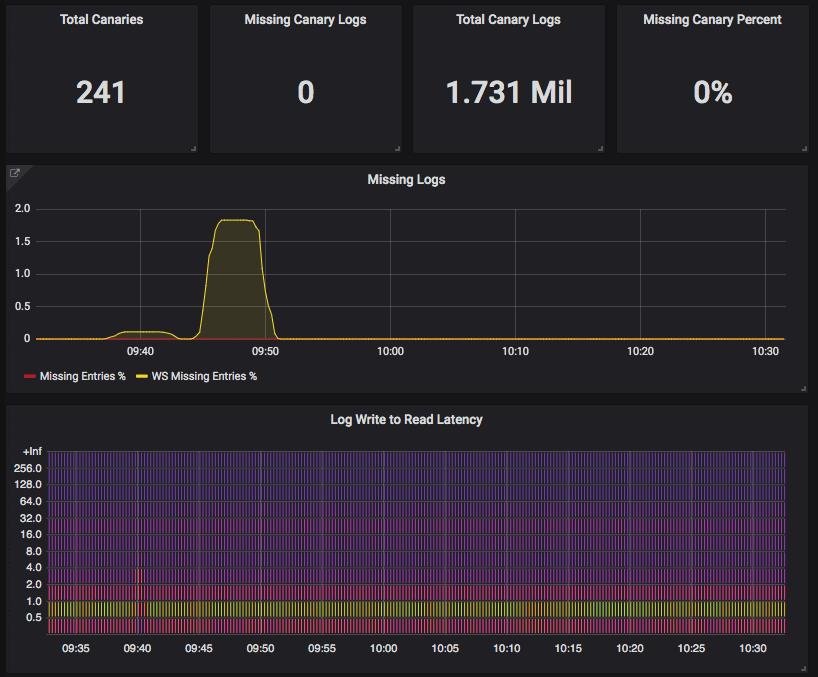
Instead we create dashboards to give us visibility into Loki’s performance:

This snapshot shows a Loki rollout around 9:40 which led to a little increase in latency and a few logs missing over the websocket connection. However, the follow-up query for the missing logs confirmed that they were in fact safely stored in Loki, and no logs were dropped during the rollout!
For more information on the loki-canary project, including how to run it yourself, check out the loki-canary documentation.
More about Loki
In other blog posts, we are focusing on key Loki features, including the Docker logging driver plugin and support for systemd, the pipeline stage, and query optimization. Be sure to check back for more content about Loki.


