

Ask Us Anything: The Most Popular Grafana Community Questions Answered!
The Grafana Labs community has more than 600 developers around the world who contribute to our open source projects. From time to time, they also ask really great questions about how to get started in Grafana, how to solve an issue, or how to implement best practices for various functions.
Here are three of the most popular questions on the Grafana community board right now – and the answers from Grafana team members and fellow developers.
Question #1
We could do with a mechanism that would allow a restored copy of grafana.db to successfully run on a new/different server. This would also be useful for running a mirror without the need to manually import dashboards between servers.
Is there a good way to achieve this? –@daveselan
Answer from Grafana Labs CGO and Co-Founder, Torkel Ödegaard
If you copy grafana.db to a new instance and restart grafana-server it should work. You also need to make sure the grafana.ini settings are the same.
After you copy the grafana.db file you need to make sure it has the right permissions.
chown grafana:grafana grafana.dbQuestion #2
I am new to Grafana. How do I create users in Grafana?
Is invite people the only way to set up new users? –@tem
Answer from Grafana Labs Frontend Developer Patrick O’Carroll
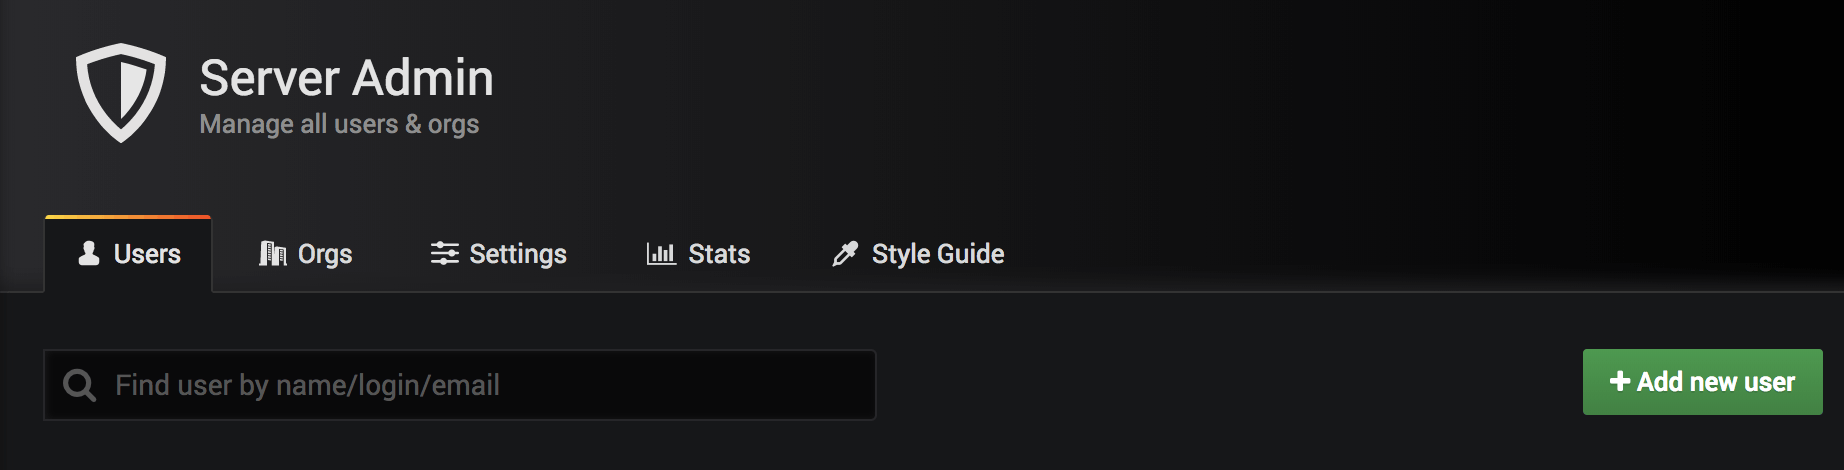
Go to Server Admin via Configuration menu. Under the Users tab, you can create new users.

Question #3
Hi guys, I’ve already spent a lot of time on this but still have no solution. Our Prometheus instance stores some interesting metrics where the relevant information saved as labels and not as metric values:
cadvisor_version_info{beta_kubernetes_io_arch="amd64",beta_kubernetes_io_os="linux",dockerVersion="17.06.0-ce",instance="minion-005056b311e7",job="kubernetes-nodes",kernelVersion="3.10.0-514.26.2.el7.x86_64",kubernetes_io_hostname="minion-005056b311e7",osVersion="Debian GNU/Linux 8 (jessie)",vendor="vmware",virtualization_role="guest"}kubernetes_build_info{beta_kubernetes_io_arch="amd64",beta_kubernetes_io_os="linux",buildDate="2017-01-12T04:52:34Z",compiler="gc",gitCommit="08e099554f3c31f6e6f07b448ab3ed78d0520507",gitTreeState="clean",gitVersion="v1.5.2",goVersion="go1.7.4",instance="minion-005056b369fc",job="kubernetes-nodes",kubernetes_io_hostname="minion-005056b369fc",major="1",minor="5",platform="linux/amd64",vendor="vmware",virtualization_role="guest"}In both cases the metric value is 1, so it looks to me like nobody is interested in values but labels.
Is there any possibility to extract values from the metrics? We would like to have a dashboard where we could see per node Kubernetes and Docker versions. What would be the best solution for that? –@Codecap
Answer from Grafana community member Dimitar Danev
In my case, to get it to display v9.4.0 into Singlestat Panel from nodejs_version_info{group=“axsportal”,instance=“localhost:6600”,job=“prometheus”,major=“9”,minor=“4”,patch=“0”,version=“v9.4.0”} 1
- Data sources: Make sure I have Scrape interval set to : 60s
- In my dashboard: Add row -> SingleStat -> Metrics tab -> Query is : nodejs_version_info. Now value displayed is 1
- SingleStat -> Options -> Value Stat (name)
- Go back to SingleStat Metrics -> Legend format {{version}}. You can pick any label of the nodejs_version_info query
One of the core tenets of Grafana Labs is the concept that products are built better together. We invite you to join the conversation or ask a question on the Grafana community board today!