What’s New (and What’s Next) in Prometheus
Björn “Beorn” Rabenstein, who recently joined Grafana Labs, is a longtime contributor to Prometheus. He recently gave talks at DevTalks Cluj and DevOpsCon Berlin about what’s been happening with the project since 2018, when it became the second project hosted by the Cloud Native Computing Foundation to graduate.
Grafana Labs’ Goutham Veeramachaneni covered some of the main improvements made by the Prometheus community over the past year in his GrafanaCon talk in February.
Picking up that thread, Rabenstein opened his talk with the idea that with its graduation, some people might think that Prometheus’s work is done – that it’s just about maintenance now. But that’s not at all the case. If you look at its CNCF DevStats page, Rabenstein pointed out, you’ll see that after graduation the activity level has actually increased.
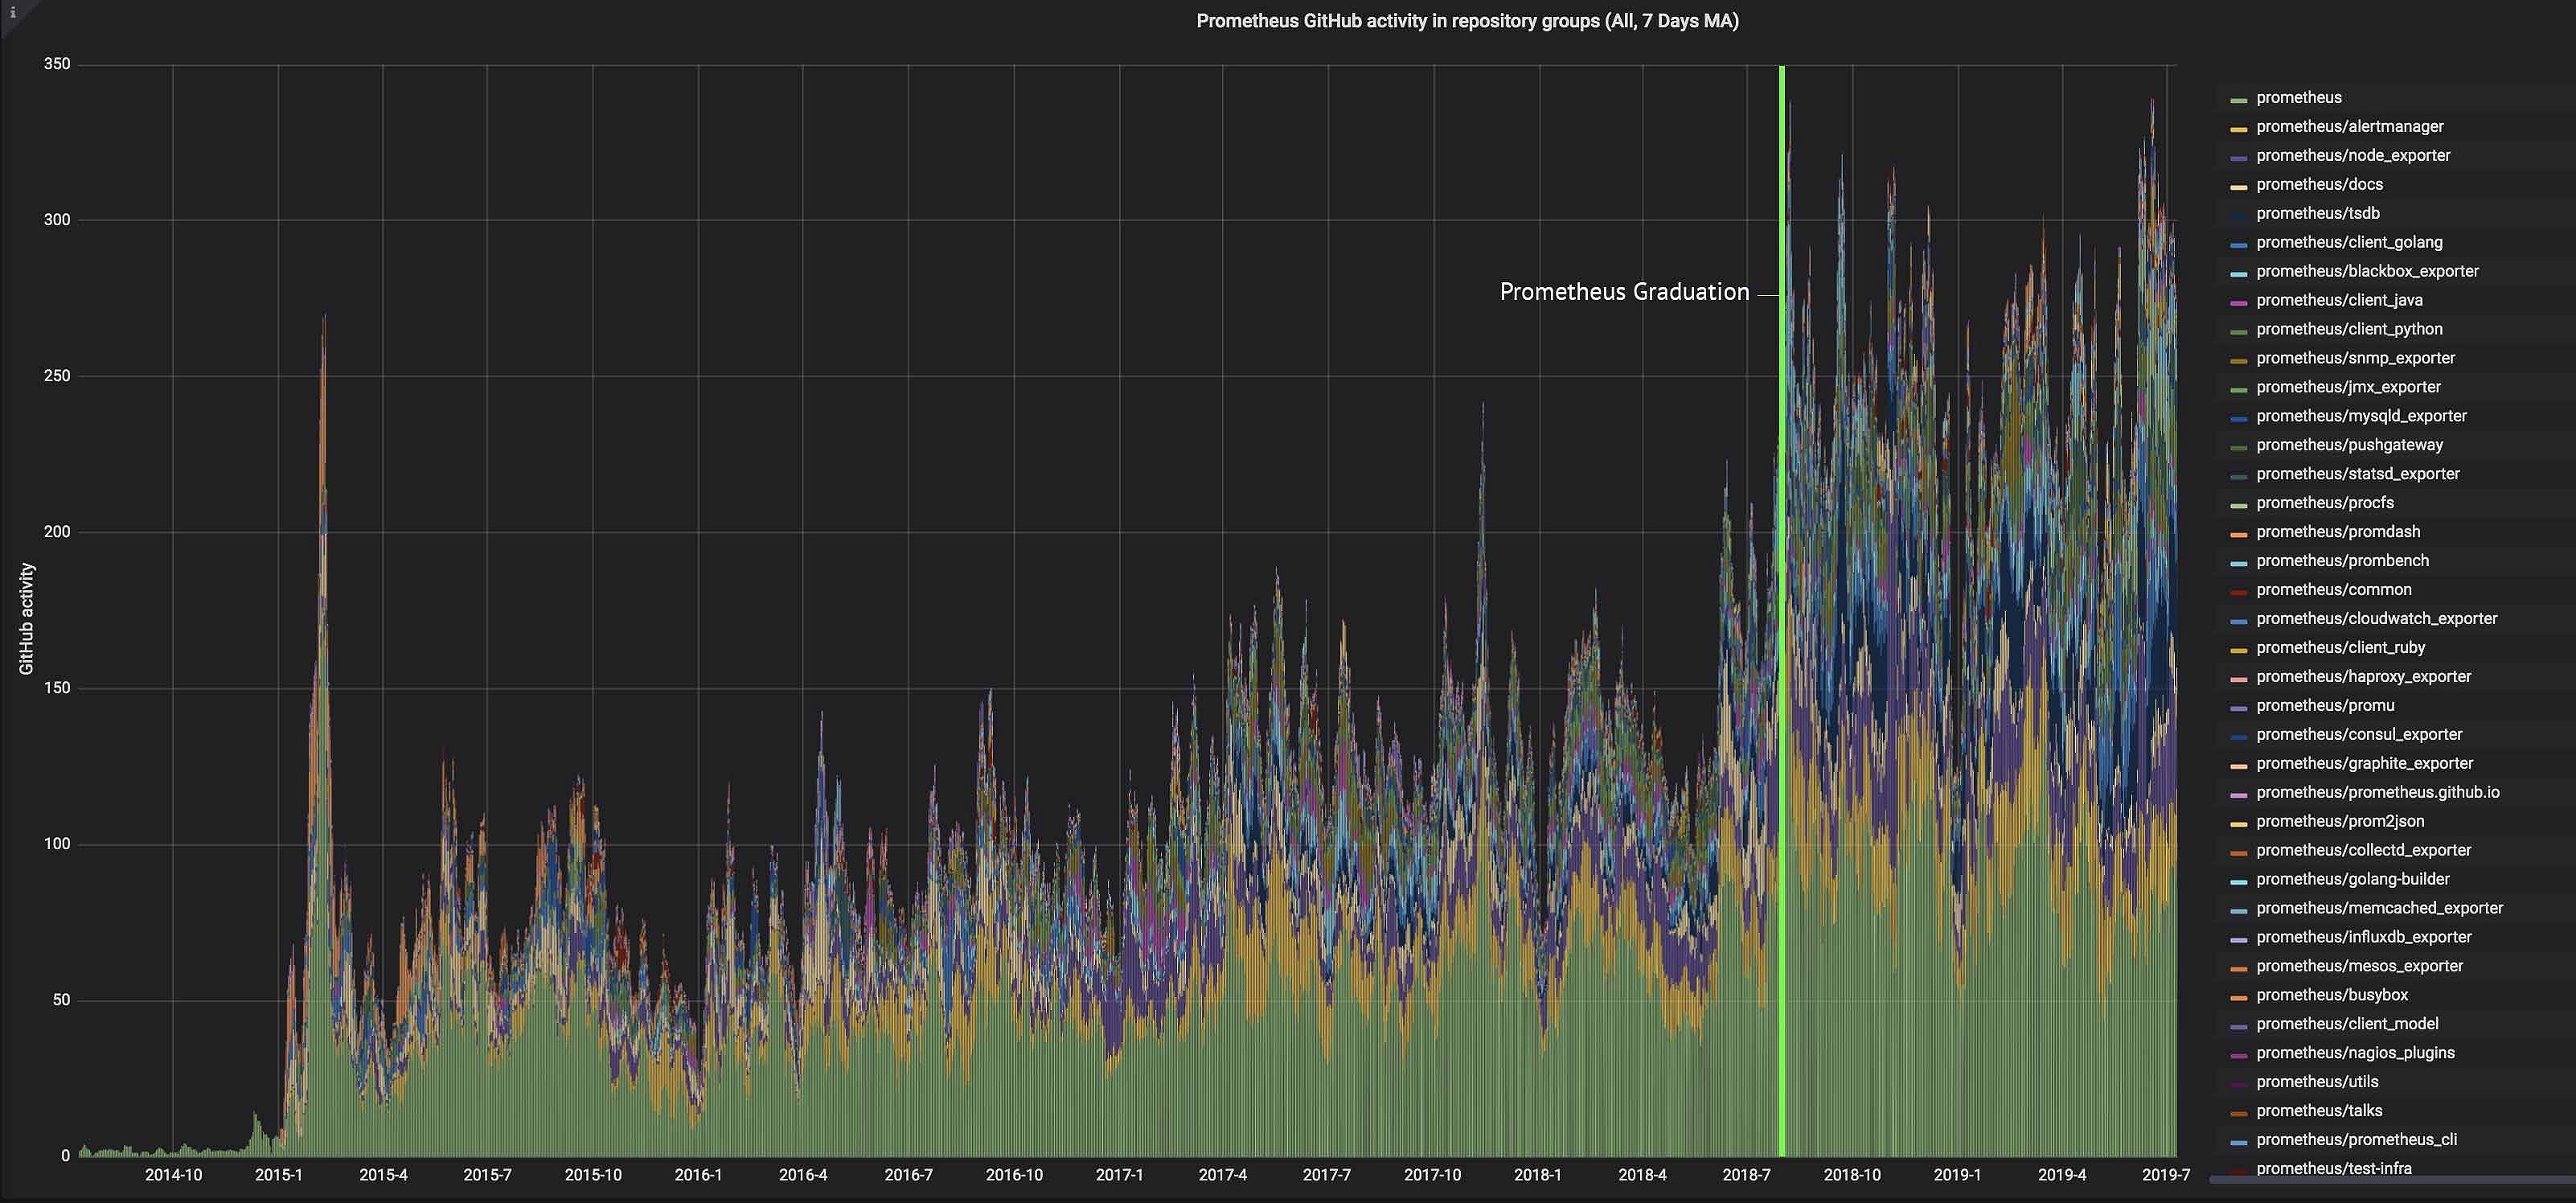
Since the time of Prometheus’s CNCF graduation, the Prometheus server has moved to scheduled regular releases every six weeks, with plenty of new features, enhancements, and bug fixes.
But there’s not just the Prometheus server itself. In fact, most of the increased activity is happening in the other repos of the Prometheus GitHub organization. And then there is the whole wider ecosystem – outside of the Prometheus GitHub repos, and thus not even included in the activity graph above.
For starters, look at the lists of integrations and metric exporters on the Prometheus project website. For Rabenstein, what’s being developed on the periphery might actually be increasingly more important and more interesting.
Grafana Labs, for instance, contributes to the Cortex project for Prometheus as a service, and is supporting the Thanos Prometheus setup. There’s also a lot of excitement around the various improvements on the Prometheus side to integrate with Cortex, Thanos, and many other remote storage solutions.
Some Highlights from the Past Year
There is only so much you can pack into a single talk. So while fully acknowledging the importance of the progress in the ecosystem as a whole, Rabenstein focused on some of the recent, noteworthy improvements made to the Prometheus server itself. Even with this constraint, there were so many topics left that it was easy not to repeat the major points of Veeramachaneni’s earlier talk.
The oldest bug fixed: Opened way back in December 2014, Issue #422 flagged the bug that the “for” state for firing alerts would be lost any time Prometheus restarted. This was known to be true from almost the very beginning of the project, and the issue was finally closed by Ganesh Vernekar, who’s now at Grafana Labs, as his Google Summer of Code project last year.
The second oldest bug fixed: Issue #968 – a request for a configurable limit for Prometheus’s disk space usage – was opened in August 2015. With the new storage engine introduced in Prometheus 2, this feature became much easier to implement. However, it still took 18 commits, 273 comments, and 7 reviewers before it was closed at the beginning of this year. In addition to (or as an alternative to) a retention time, you can now tell Prometheus how much disk it may use before starting to delete old metrics data. Also interesting to note, said Rabenstein, is the fact that a lot of work on this feature was done by an infrequent contributor outside of the core developer team, who just came along, wanted to fix something, and did it.
PromQL optimization and sample limit: There are two easy ways of overloading your Prometheus server, up to a point where it simply crashes: Trying to ingest too many metrics, and running expensive PromQL queries. There had been ways to address the former problem in place for a while – essentially levers to limit excessive metric cardinality. However, accidentally (or maliciously) entering an expensive query that could OOM the server remained a relevant problem. Rabenstein highlighted the Herculean effort by Brian Brazil to optimize PromQL towards higher speed and less memory usage. After that, it was harder to hit a query that would overload the Prometheus server. This work also created the plumbing to introduce a limit to the number of samples that a query could load into RAM. Callum Styan of Grafana Labs implemented this limit in v2.5, which is configurable via the --query.max-samples flag and defaults to 50,000,000. A query that would exceed that limit is aborted. Rabenstein advised that if you are tight on RAM, you should set a lower limit. And conversely, if you have plenty of RAM and like to run expensive queries, you need to increase it to prevent the Prometheus server from killing your queries prematurely.
Subquery Support: Issue #1227 used to be the frustrating answer to one of the most frequently asked questions about Prometheus: What do you do when you apply a range selector to another range selection, and all you get is a seemingly gibberish error message? It was solved by the aforementioned Ganesh Vernekar with subquery support, which was added in v2.7. You can also find some real-life examples of how it’s being used at Grafana Labs in this blog post.
What’s Coming Up
A good way to see what the Prometheus community is currently working on is to look at the official roadmap:
Server-side metric metadata support: Prometheus has traditionally completely ignored the help string and type that monitored targets exposed for each metric. “Hardly noted by anybody, v2.4 started to keep this data in memory, and you can retrieve it with an API,” said Rabenstein. “Sadly, nobody seems to make use of it so far. An obvious use case is tool tips displaying the help string next to metrics in Grafana or the internal Prometheus expression browser. Utilizing the metric type will be a more involved effort, opening up a whole new dimension of dealing with your metrics.”
Adopt OpenMetrics: The OpenMetrics project is progressing slowly, but whatever comes out of that, Prometheus will support it, Rabenstein said: “It’s a specification of a metrics exposition format heavily based on what we know from Prometheus. But it should be an open and shared standard that isn’t just dictated by the Prometheus team.”
Backfill time series: “The plumbing to enable backfilling of data has been added to the storage backend, but that doesn’t mean that you can just backfill data via an API call yet,” said Rabenstein. “‘Backfill’ allows you to put individual time series from other time-series databases into Prometheus. It will also enable retroactive evaluation of recording rules. The Prometheus storage backend is optimized for appending real-time data simultaneously to millions of time series. The backfill scenario is technically much simpler, but with the way the Prometheus storage backend is designed, it’s a quite expensive operation. That kind of operation is implemented now, but we are still missing easy tooling to make it simple to backfill or to just add a recording rule to Prometheus and tell it to retroactively evaluate it for the whole retention period.”
Summer of Code
Rabenstein gave a shout-out to Google Summer of Code (GSoC), the program under which Ganesh Vernekar and others did loads of work on Prometheus, as mentioned above. And, he pointed out, there’s more underway this year too.
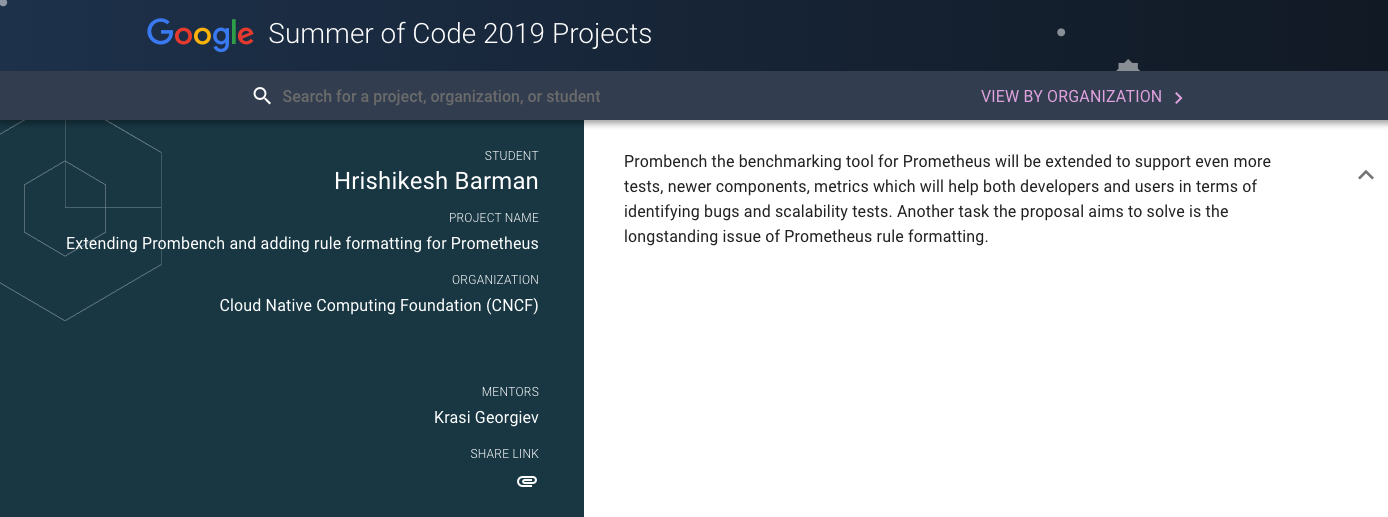
Prometheus and related projects are mentoring a number of students in this year’s Summer of Code as they work on things such as extending the GitHub-integrated benchmarking tool for Prometheus TSDB, and various optimizations in the query and storage layer. Rabenstein spotlighted their work on the PromQL formatting tool. “Expressions written in PromQL, the Prometheus expression language, can become pretty daunting, and it’s nice if you have a tool that indents and line breaks everything in a readable and canonical fashion,” he said. “The Summer of Code is a great thing. We’ve had so much success with that.”
All together, the Summer of Code participants, the maintainers, and the regular and occasional contributors alike are helping to keep the Prometheus project active and evolving, long after graduation.
For more about these topics, check out the Prometheus content on our blog.


