How to Mix Metrics and Logs with Grafana and Influx
It’s time to stop thinking of Grafana as a general dashboarding tool.
“Grafana Labs is on a journey to becoming a developer’s observability platform to support your classic DevOps use cases,” said Grafana Labs’ Director of UX, David Kaltschmidt, at a recent talk given at the 2019 InfluxDays Conference in London.
While Grafana Labs continues to support Influx, more datasources, as well as the three big cloud vendors, it’s also dedicated to developing new features with DevOps in mind.
One example is the new Explore mode, which is available in Grafana version 6.0 and above. This is in addition to the existing dashboard panel editing experience when looking at Influx data through Grafana.
“If you don’t want to be distracted by all the panel editing visualization styles, you can switch into the Explore mode which will take over the query. There, you can just modify the query without having the fear of modifying the dashboards,” explains Kaltschmidt.
“This supports the DevOps story where you want to just drill down a bit more and change some queries to figure something out – and it’s using the same query builder,” he said.
Here, Kaltschmidt outlines how Grafana Labs has added more support in the Explore workflow for visualizing both metrics and logs for the Influx datasource.
Why Log Aggregation Matters
The troubleshooting process is a familiar journey: It starts with an alert that leads an engineer to various dashboards. The engineer then tries to modify queries and drill down until they discover which process or server might be the root cause of the issue. Finally, there is a deep dive into logs to try and uncover more details on what potentially went wrong.
Logging is central to this process – especially for those engineers who might not even have dashboards or metrics to begin with. For them, logging may be the only option to investigate an alert.
Which is why a log aggregation system is important. If logs simply live on machines, “what if the machine goes away?” said Kaltschmidt. “Then the logs go away as well. That’s one of the main reasons why it makes sense to have a central place to store your logs and have a log aggregation system in place.”
How Influx Works with Logs
Unlike most time series databases, InfluxDB allows users to store numeric values as well as string (or text) values. “We leverage this function for logs, and turns out, it works great,” said Kaltschmidt. Plus, he added, there’s no need to add another layer of operational complexity with a second system to store your logs.
But the next question is: How do you use the Influx paradigms together with the desire to isolate log streams and properly tag and label them?
Without this functionality, logs are often aggregated into a single location, and “you end up with this big pile of information,” said Kaltschmidt. “Then if you later want to revisit data, there’s just a long stream of messages. You’re going to have a really tough time finding the exact message that will tell you what was going wrong.”

Kaltschmidt outlined a model for log streams in Influx in which “logs” are used as the measurement and “message” is inputted as the value. “This allows tags to really give us the flexibility to isolate the log streams. There can be isolation by a datacenter, host, a file name, whatever you like,” said Kaltschmidt.
In the end, engineers can use tags to filter out the logs they don’t need and strictly focus on the ones that will help them resolve an issue.
How Do You Get Logs into Influx?
There are three ways to ingest logs into Influx.
First, Influx has an API, which is a node.js client library.
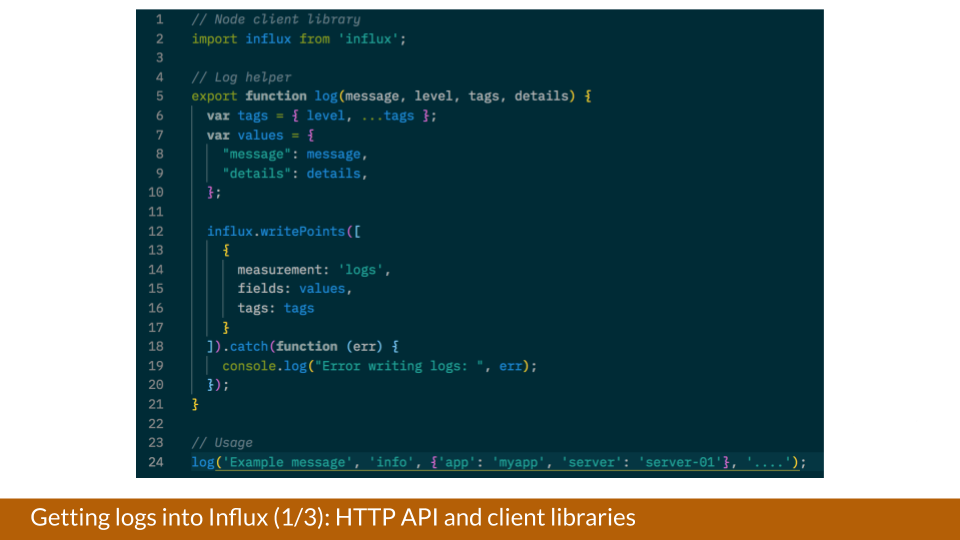
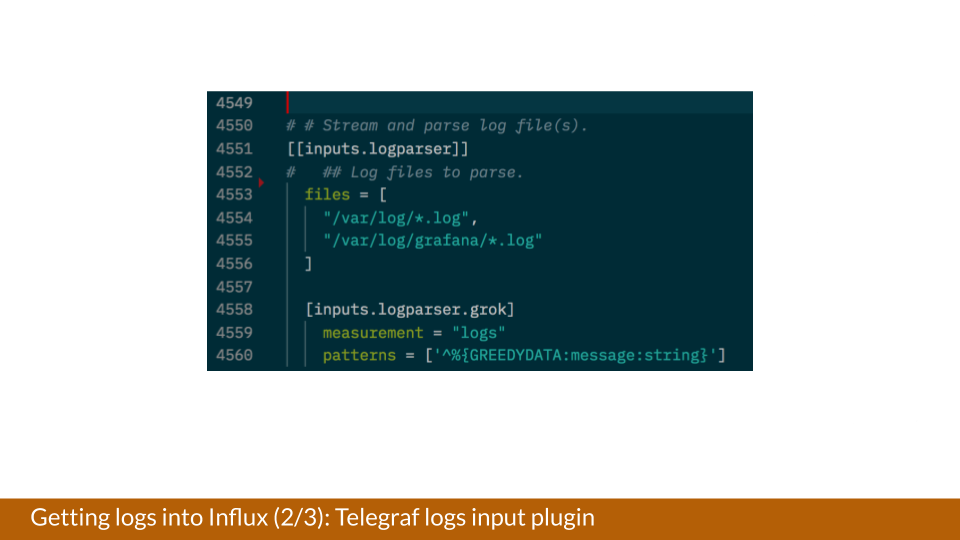
But sometimes this programmatic log generation doesn’t work for an organization. Another option is using Telegraf, a plugin-driven server agent for collecting and reporting metrics which allows users to tail logs or files with an input plugin called Logparser.
“This is how I can make sure that I end up with the data in a format that I can later consume within Grafana,” said Kaltschmidt.
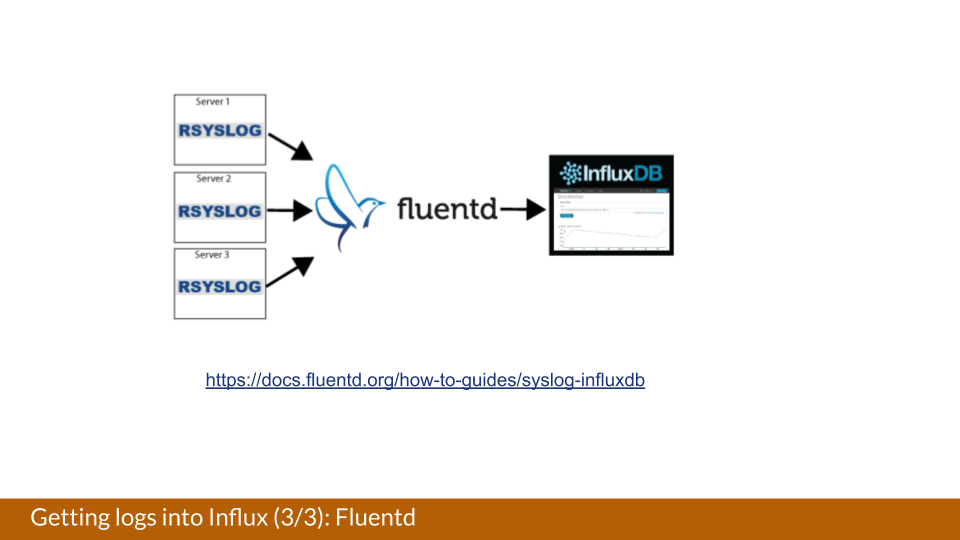
The third method, Kaltschmidt said, “I found on the Internet.” If you have a setup that utilizes search log daemons running on your nodes, then Fluentd could also be an option for ingesting logging data into Influx.
How to Explore Log Data with Grafana
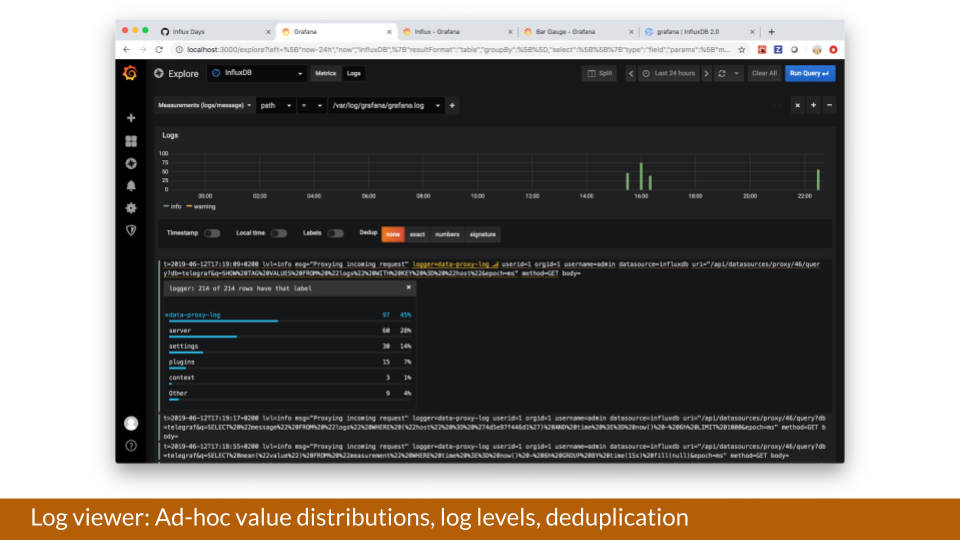
In Grafana’s Explore mode, there is a new log query viewer in the nightly builds, and it will be released in version 6.3 to be compatible with Influx 1.7 and soon Influx 2.0.
New Explore features include:
- Tag-Based Filtering For example, by selecting “logs message” you can see tags that will allow you to filter down by log file.
- In-Browser Analytics By default, Explore loads 1,000 lines in the results, which “we think is a big enough data set to do simple distributions on, for example, key-value pairs.”
- Local-Level Extraction
- Deduplication
- Multiple Query Rows This allows you to have a multiplex of various log files together in the same results set.
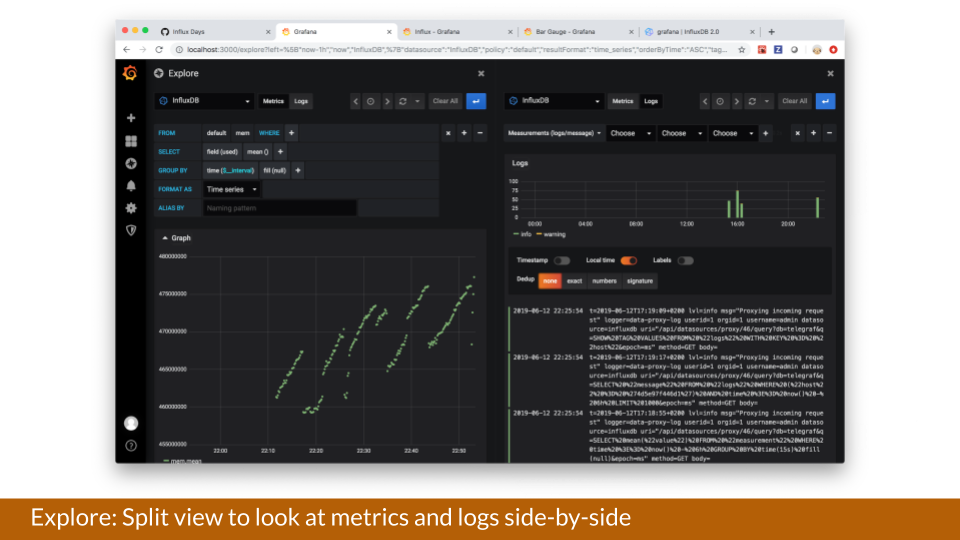
“The feature I’m actually most excited about within Explore is the split view,” said Kaltschmidt.
In Explore, the user starts with one metrics query. When they click on “split,” the screen splits and copies the query giving you the same query twice in a split view. Now one query can be dedicated to metrics, and the other can be switched to logs so “you can really view them side by side,” said Kaltschmidt.
Currently the only correlation linking the split queries is the selected time range (i.e. the last hour or, in the example below, the last six hours).
In the future for InfluxDB and Explore, when switching from a metrics query to a logs query, the tags will be kept in tact and link the two queries as well. So if a metrics query has the tag “Europe” and then the user switches to logs, it would keep that tag and query logs with the tag “Europe" as well.
For a demo of how Grafana works with Influx to monitor logs, click here.
What’s Next for Grafana, Influx, and Flux?
Flux is currently an external datasource and version 5.3.1 of the Flux plugin for Grafana was released this month with features such as a Flux expression editor and token authentication.
You can install the plugin via Grafana CLI, and if you come across any issues, visit this repo.
For Kaltschmidt’s quick tutorial on setting up the Flux plugin, click here.
While the Grafana Labs team is working towards allowing users to query logs with the Flux query language and improving the tag filtering UX down the road, the bigger task at hand is to unify the Influx and Flux datasources “to have a bit more clarity,” said Kaltschmidt.
Admittedly, “it’s a bit annoying to have these two datasources,” said Kaltschmidt, who is aiming to have “only one Influx datasource in which you say what version you’re on and if you want Flux or not.”
But overall, the goal is for Grafana to continue to be part of the conversation around logs. “Log aggregation is becoming a centerpiece for this troubleshooting story in observability that Grafana wants to support more and more,” said Kaltschmidt.

