

How Grafana Labs is Democratizing Metrics Now
Metrics for all – and all for metrics.
At Grafana, we not only strive to give people a “single pane of glass” to unify observability metrics. From the very start, our mission has been to advocate for the democratization of metrics, which is the idea that the paradigm needs to shift between who can store data, why they need to store it, and, ultimately, what they’re able to with it.
And Grafana users are a great example of how vast and varied the needs are for data access. There are almost a quarter million active installs of Grafana implemented by organizations ranging from Fortune 500 companies to small businesses. Even individuals interested in home automation have set up dashboards to track things such as power usage or temperature control.
It’s really exciting to see the convergence of people feeling empowered to visualize data and excited about using time series and measurement data. But in the old days, information wasn’t as accessible.
If you needed any metrics, you would have to often bother one person and say, “Hey, I really want to store this type of data.” You’d then have to convince that person it was worth the time, and maybe a couple of days (or weeks) later, you might have a graph that looks pretty good. But then if you wanted to modify the data or change the visualization, you’d have to go knock on the same door and repeat the same process.
With the rise of open source time projects like Prometheus, InfluxDB and Graphite, paired with Grafana, a self-service metrics model emerged in which the ability to both store and use metrics lands in the hands of those running projects themselves.
And with that, the standard for sharing information has evolved to become more unified, centralized, and, therefore, democratized. At a recent talk I gave at the Time Series Data Virtual Summit, I outlined three ways Grafana Labs advocates for the democratization of data through our work.
(For the full talk, register for Time Series Data Virtual Summit.)
1. Give Easy Access to Metrics
Grafana has always allowed anyone to go out of the box and dynamically filter through stored metrics efficiently – but in a way that still has guard rails to prevent duplication and sprawl.
So now when a visualization isn’t quite answering the question or you’re not really positive what’s going on or even how it’s being constructed, instead of picking up the phone or sending an email to the person that you think created that dashboard, the user can easily go deeper in Grafana and look at what this query is actually doing.
Even if you don’t know the query language itself, Grafana query editors are designed in a point-and-click way that’s intuitive. All this allows engineers to deploy and share data with people, all across the organization, who may not be intimately familiar with how to do it themselves.
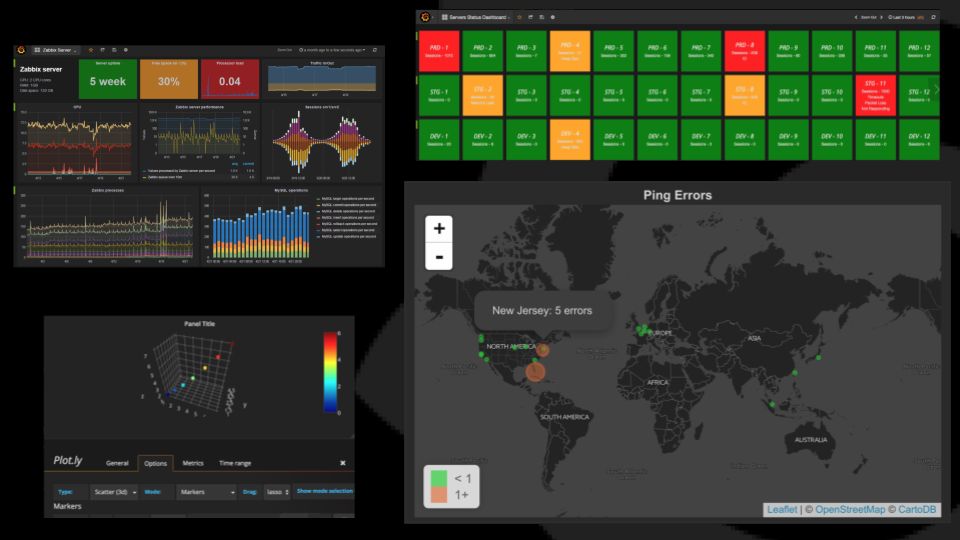
So if, for example, your team is storing CPU and server metrics, and you want to share that externally with other folks, you’re able to create dashboards that are interactive and individuals don’t have to hunt or dig for data they need. The dashboards can provide a 30,000-ft. overview to communicate what’s successful – and what’s not – across teams and up the chain of command in an organization.
2. Give Better Context to Make Decisions
As the VP of Experience at Grafana, the scenario I often see when I go into companies is what we call “Yet Another Portal” Syndrome.
There’s a bunch of shared teams, and they’re looking at different portals and logging into different places. There’s a lot of disconnected context where an individual team might have a handle on what they’re doing, but shared information doesn’t exist within a centralized place. So when a problem occurs and it comes time to troubleshoot, the scene quickly starts to look like one of those detective shows where they have the red strings tied in every direction.
With Grafana, the ease of use proliferates beyond the core observability organization so that more people are confident in manipulating the dashboards themselves. You can drill down, zoom in, zoom out, and you can interact with data in dynamic ways all the time. Users can interact with variables themselves so that they’re driving down the context to get to the information that matters to them as quickly as possible.
The goal is always to help someone make the best decisions efficiently so that the consumer gets value without having to do a lot of work – nor does the engineer.
And while Grafana is often initially paired with metrics backend, it also connects to Elasticsearch, log systems like Splunk, and Web APIs. And as an open source project, the decision to access other services that you can leverage in Grafana is in your hands, when you don’t want to rewrite data or store metrics separately or for the long term. You can even connect to Stackdriver or Azure and layer that on top of other metrics to create a more nuanced, informed analysis of your organization.
3. Give People the Power to Improve the Product
One of the other core tenets of Grafana is this concept of built better together. This idea that we are putting something out in the world, but the only way that it continues to push forward is with the collaboration of both the people who are solving problems every day as well as the core teams who help drive that project.
The Grafana community includes 600+ developers around the world. This collaboration is really where the rubber meets the road, and why products turn into core parts of observability in companies as opposed to just little projects on the side.
We have a few resources that are helpful to showcase how people have used Grafana and some of the interesting visualizations they’ve created themselves. On Grafana.com you can find community-driven dashboards and plugins under the Dashboards section. You can filter down by data sources to see a collection of dashboards that people have published and are proud to share. You’ll see tips for configuring template variables, things like repeating panels and other tricks you wouldn’t have even thought to try. You can remix those dashboards and apply them in your own world.
And of course a central part of who we are is that we are an open source project so you’re able to shape the future Grafana. When you’re having problems, the Grafana repo on Github is your primary interface for raising issues. And the core development team is super active there. The fastest way to push along Grafana, and get what you want out of it, is to participate in the open source community.
Ultimately, where Grafana really excels is shortening the time between solving problems and easily sharing the results within the organization at large. We encourage you to continue to help your team and other teams visualize metrics, create alerts, log immediately actionable data, and share the information widely. And we think that Grafana and Influx is a wonderful way to get started with that.
