

Grafana Labs at KubeCon: Loki’s March Toward GA
At KubeCon + CloudNativeCon EU this week, Grafana Labs VP Product Tom Wilkie gave a talk about Loki, the Prometheus-inspired service that optimizes search, aggregation, and exploration of logs natively in Grafana. In case you missed it, here’s a recap.
Wilkie’s talk is an overview of how and why Grafana Labs built Loki and the features and architecture the team built in. Our policy is to develop projects in the open, so the design doc has been publicly accessible since development started. Loki was launched at KubeCon North America last December; the project now has more than 6,000 stars on GitHub.
“Loki is our horizontally scalable, highly available, multi-tenant log aggregation system,” Wilkie says. “We’ve tried to make Loki as close to the experience you get for metrics with Prometheus, but for logs.”
Here are the main features:
Simple and Cost-Effective to Operate
Existing systems that do log aggregation use inverted indexes. They take every line of logs, split them up into tokens, and then insert a tuple for every single token. One great benefit of indexing all of the fields within a message or a log line is that it makes searches really fast.
“This is how Google does searches on the internet, so it’s a really proven technology,” says Wilkie.
But it’s really hard to scale inverted indexes. The index is the size of the data ingested. “The other problem with inverted indexes is you end up either sending all of your writes to all of your nodes, or you end up sending all of your reads to all of your nodes in your cluster, and it makes them hard to scale for both interactive read and writes,” says Wilkie.
So the team adopted a different data model. “We have a series of tags, like a bag of key value pairs for each stream within the database,” says Wilkie. “The streams themselves are not indexed. This means our index, which we use for the tags, is much smaller. On our dev environment, we’re ingesting >10TB a week, but the index is like ~500MB. It’s more than four orders of magnitude smaller.”
Data is grouped together into chunks that are compressed up to 10x. This model makes it much easier to scale out the system and operate it. Plus, “by using these tags, and by getting these tags from the same place we do for our Prometheus metrics, it makes it really easy to switch between the two,” says Wilkie.
Integrated with the Existing Observability Stack
Imagine what happens when you’re on call and you get an alert. There are multiple steps, and multiple systems, to work through to pinpoint a problem.
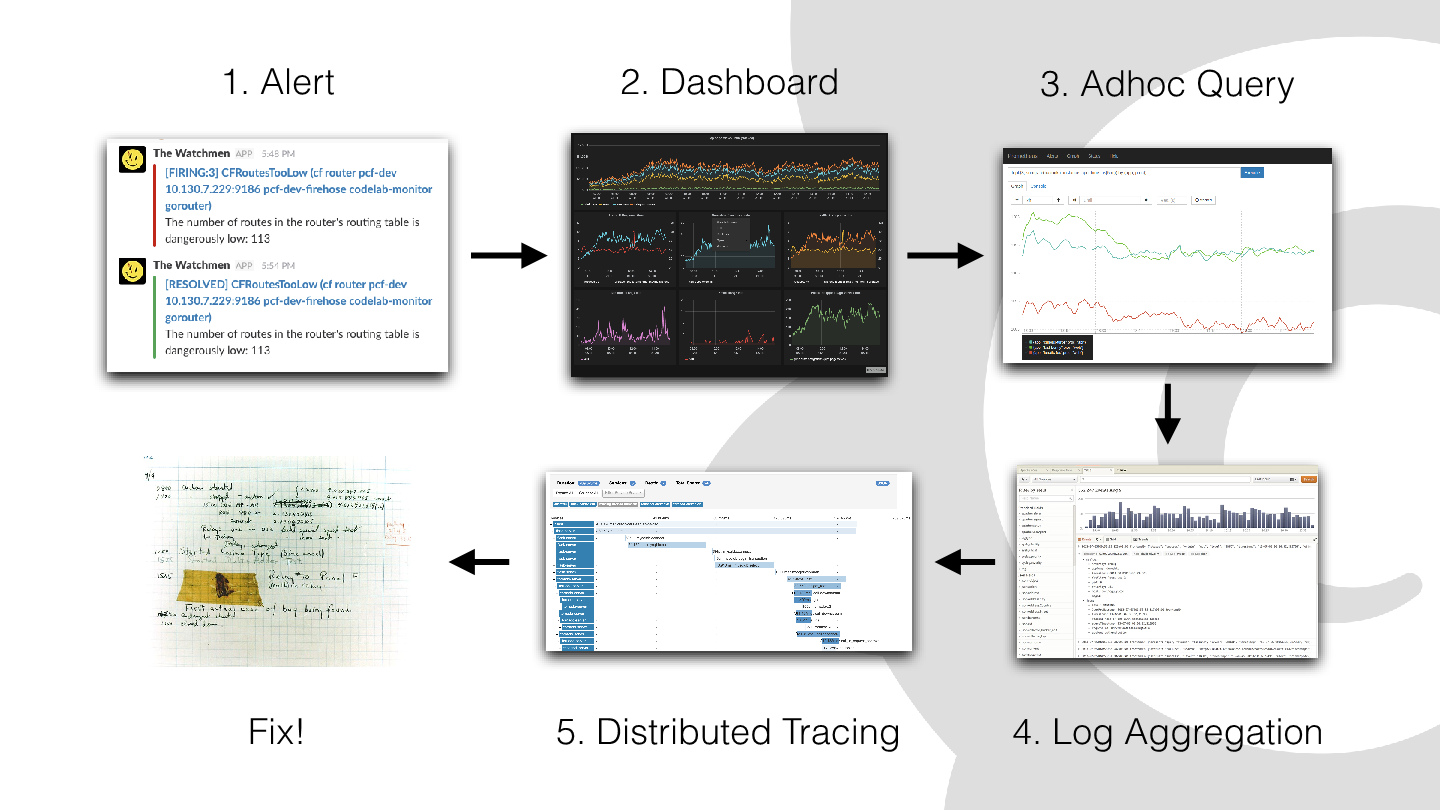
“As you can see, we’ve had to use five different systems. If you include Slack or PagerDuty and every step, you’ve had to manually translate between them,” says Wilkie. “Preserving that context throughout this flow is really hard, and that was the problem we wanted to solve.”
Prometheus has a relatively simple data model. “If you want to do a query, you generally specify a set of matches against labels and that will select some set of time series that you’ll then rate, aggregate, apply percent or maths to, do whatever you need to do to turn that raw data into the information you display on your dashboard,” says Wilkie.
To get these labels, the Prometheus server talks to the Kubernetes API server and asks it what services, what pods, what deployments, what objects do you have in your object model? Then, you apply a set of rules to those objects you return. These are called relabeling rules.
“If you just include in the job name the name of the service, it’s very common to accidentally aggregate together your dev and your prod environment,” says Wilkie. “Part of the relabeling we do is to put the namespace name into the job name, and this stops us from making that mistake.”
The same thing is done in Loki. “The data model for Loki is identical to the data model for Prometheus, except we’ve changed the values, which were float64s, to bytes,” says Wilkie. “And then, to gather these values, we use the Prometheus code base, embed it into a job we called Promtail. It will go and talk to the Kubernetes API server, gather a list of targets, relabel them so they’re consistent. You can really easily and quickly switch between metrics and logs for a given service.”
For more about how Loki correlates metrics and logs – saving you money – check out this blog post.
Cloud Native and Airplane Mode
For developers who travel a lot, working on a technology that doesn’t require an internet connection is a big bonus. “I really wanted Loki to be the kind of thing I could develop on my laptop when I’m disconnected,” says Wilkie.
So the team made Loki a single binary that can run as a single process.
“You can store your logs on disk,” he says. “Of course, my laptop’s got limited storage. Your single server and your data center’s got limited storage, so we need to make it scale out. So the same binary, with the same technologies, can scale out.”
The solution: Install it on multiple servers. Install Promtail on all the clients you want to scrape logs from, and “it’ll collect those logs and send them to your Loki cluster. It uses the technology you should all be familiar with – distributed hashing, dynamo style replication – to achieve this, and then it can use the local disks.”
Grafana Labs also offers a hosted version of Loki, and that uses a microservices architecture. By design, Loki can work as both microservices and monoliths.
“We have the microservices architecture where we’ve broken up every single one of the services into individual functions almost, where we’ve got a separate read path and a separate write path,” says Wilkie. “We’ve got caching at every single layer, and then we don’t like local storage when we run Grafana Cloud. We like to use cloud storage. So, in Grafana Cloud, we use Bigtable and GCS to store the chunks. The Bigtable stores the index, and the chunks go in GCS. But again, this is all pluggable, so you can run this in Amazon, Azure, MinIO. We support all of that.”
In building Loki, “we’ve adopted all of the best practices for cloud native,” says Wilkie. “We’ve made it containerized, we’ve made it Kubernetes native, we’ve used cloud storage, and we’ve made it so it can run at massive scale in the cloud.”
What’s Next
The team is working on LogQL, a query language like PromQL. (Check out the design doc.)
“We’ve heard the feedback from everyone who’s used the early versions of Loki, and we’re going to add alerting to Loki so you can alert off your raw log streams,” says Wilkie. “We’re probably going to do that using LogQL. We want to make LogQL so you can combine Prometheus queries and log queries into a single metric and extract metrics out of your logs. That’s a great way of building alerts off of logs.”

