Worth a Look: Public Grafana Dashboards
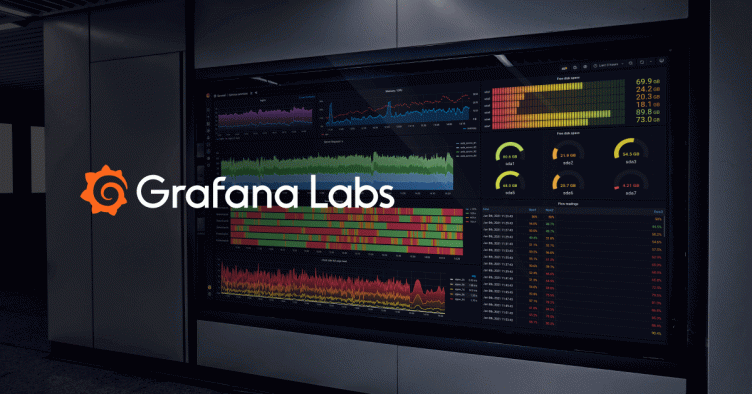
There are countless Grafana dashboards that will only ever be seen internally. But there are also a number of large organizations that have made their dashboards public for a variety of uses. These dashboards can be interesting to browse, giving you an insider’s peek into how real Grafana users set up their visualizations, with actual live data to boot.
Perhaps some of them will inspire you to get to work on your own Grafana?
GitLab
GitLab is a famously transparent company. They’ve even live streamed internal outages in the past. So it’s not surprising that they’d make a bunch of their internal Grafana dashboards for their cloud infrastructure public. The GitLab Dashboard offers graphs on everything from disk stats to fleet overviews, to alert reporting and triage.
Wikimedia
As one of the most popular sites on the Internet, Wikipedia operates at a truly incredible scale. The foundation behind the site exposes its Wikimedia Metrics via Grafana dashboards. The dashboards range from a global datacenter overview to API request rates. Be sure to adjust your eyes for some of their mind-bogglingly high numbers.
Cloud Native Computing Foundation
CNCF’s DevStats tool provides analysis of GitHub activity for Kubernetes and the other CNCF projects. Dashboards track a multitude of metrics, including the number of contributions, the level of engagement of contributors, how long it takes to get a response after an issue is opened, and which special interest groups (SIGs) are the most responsive. Grafana Labs is a member of the CNCF, and while we provided some help in getting DevStats up and running, the CNCF has put a lot of effort into this open source tool. It’s impressive to see what they’ve accomplished.
Grid Computing Centre Karlsruhe
GridKa, which is the home to the Large Hadron Collider, visualizes its data with a public GridKa Grafana that tracks everything from cluster utilization to system metrics for its experiments. Grafana powering science.
CERN
The European Organization for Nuclear Research operates the largest physics laboratory in the world. You can find more details about the experiments that members are doing at the Large Hadron Collider and other facilities on this public Grafana. Note those are tens of Gigabits per second they’re talking about.
Zabbix Plugin
There’s a Grafana plugin for the Zabbix open source network monitoring system that’s maintained by one of our Grafana Labs team members, Alexander Zobnin, and his play site provides a good demo of how the plugin works.
OGC SensorThings Plugin
This is a demo site for a plugin for the open source framework for interconnecting IoT. The example shown here is live tracking of a shuttle bus.
Hiveeyes Project
The open source Hiveeyes Project is developing a flexible beehive monitoring infrastructure platform. This public Grafana visualizes weather in Germany.
Percona
The Percona demo site offers examples of its Percona Monitoring and Management dashboard. It’s an open source platform that provides time-based analysis to ensure that your data works as efficiently as possible.
Grafana
And of course there’s the Grafana Play dashboard. This is one of the original public Grafana instances, hosted by Grafana Labs. It has served multiple purposes. First, it’s a demo site for people to get introduced to the various features and capabilities of Grafana. We also use it as a way to test issues or fixes, or demonstrate particular features.


