

Grafana Plugin Tutorial: Polystat Panel (Part 2)
Polystat grafana-polystat-panel plugin
Continuing from Grafana Plugin Tutorial: Polystat Panel (Part 1)…
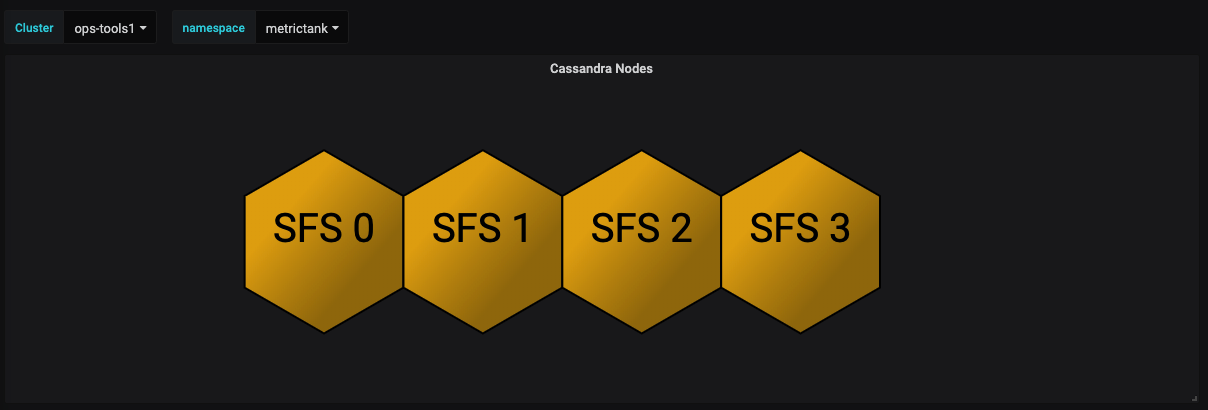
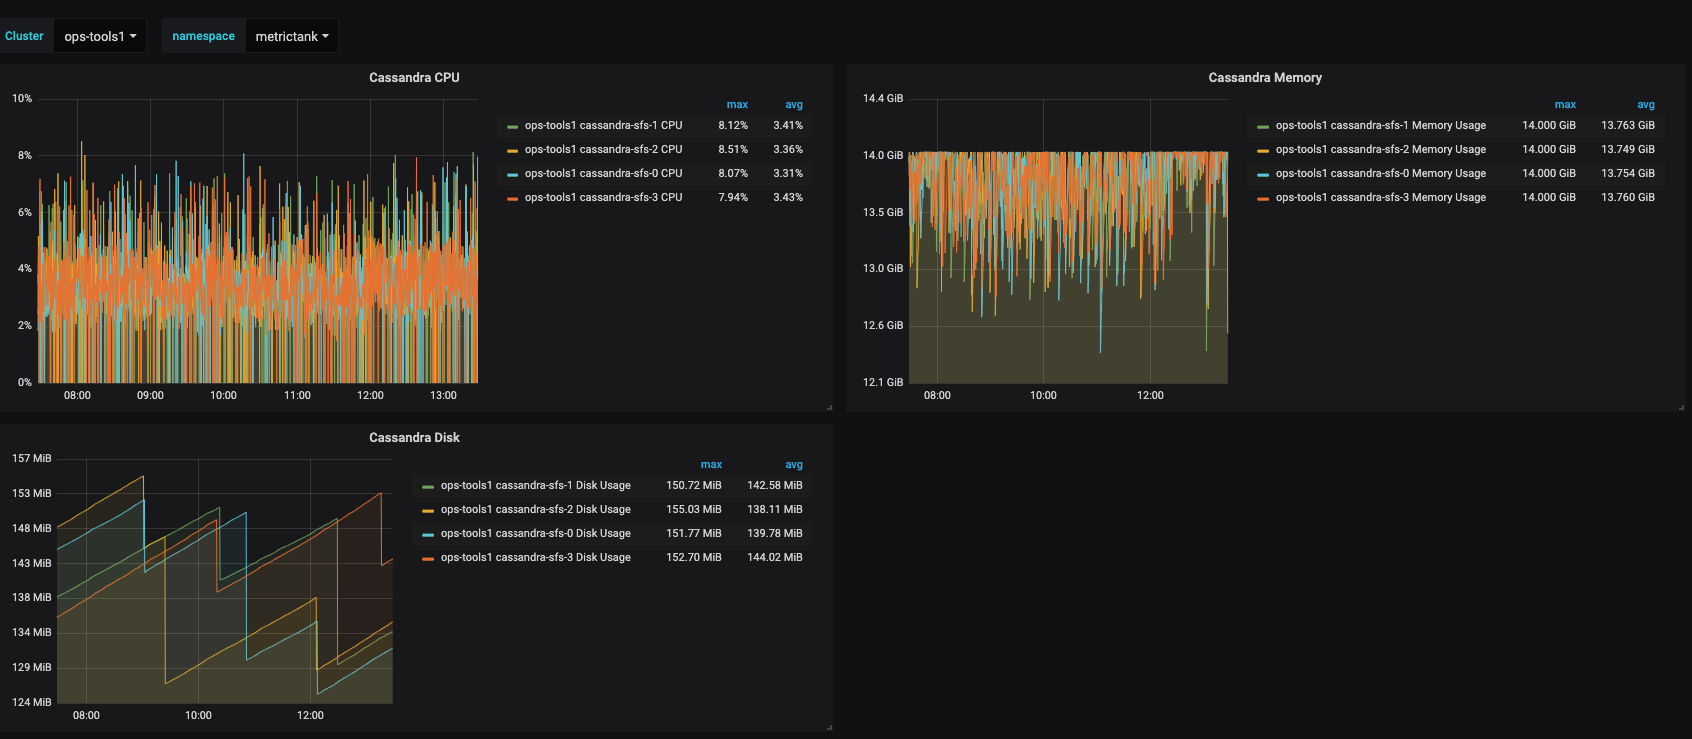
At the end of Part 1, the end result was a set of polygons that represented each Cassandra node in a Kubernetes statefulset. The cAdvisor-based metrics CPU/Memory/Disk utilization are scraped by Prometheus.
This second tutorial will focus on a rollup of multiple Cassandra clusters running inside Kubernetes.
We will end up with three dashboards tied together to provide an overview of our Cassandra clusters.
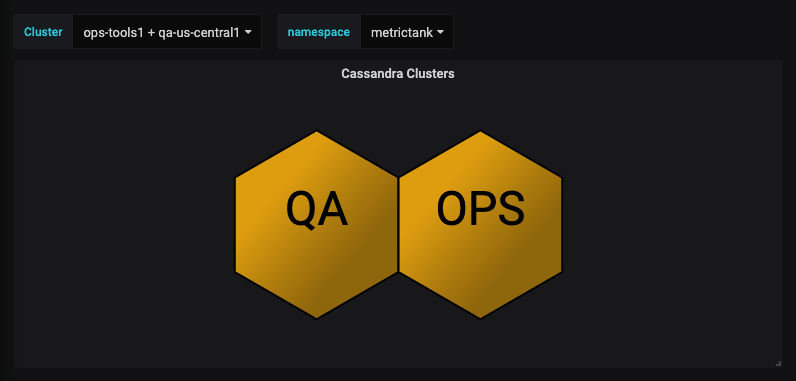
The dashboard will start with the overview:
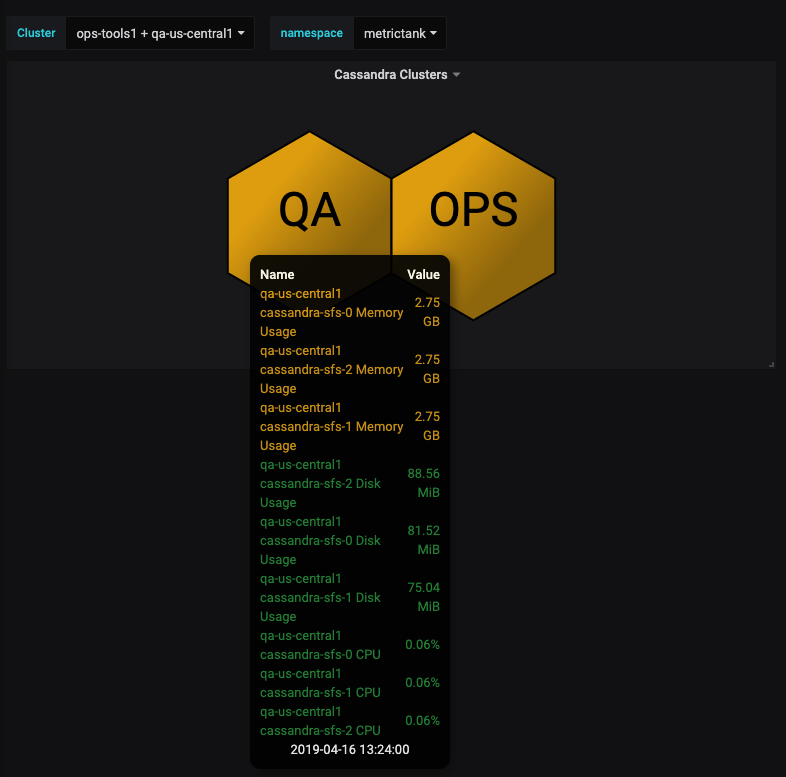
Hovering over a cluster will show the metrics included in the Tooltip:
Clicking on one of the clusters, in this case Ops, will take you to a per-node view:
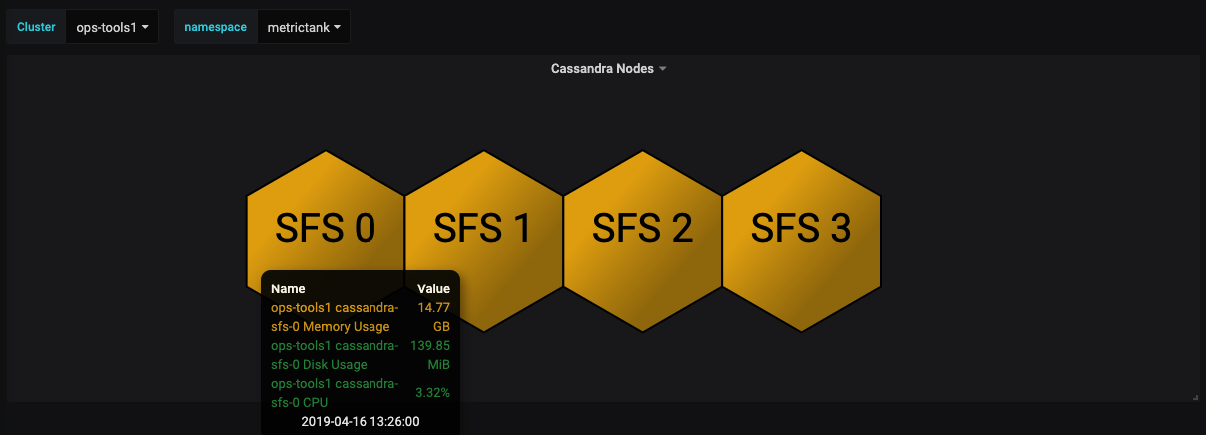
Clicking on a node will take you to a detailed metric view:
High-Level Rollups
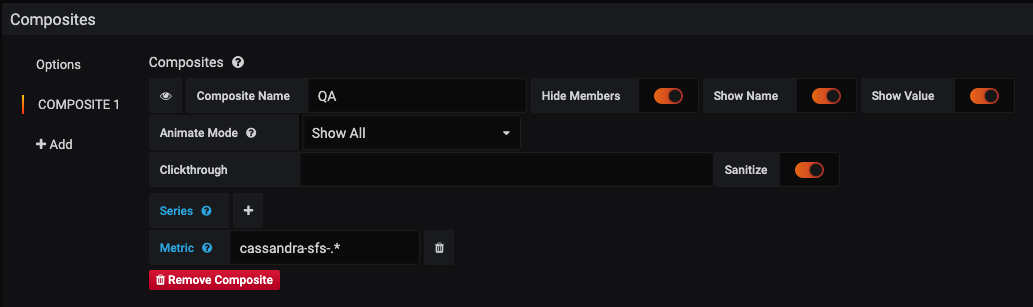
The previous panel showed each node in a cluster and displayed the metrics associated with each node. To indicate a higher-level view, the composite just needs to be modified to match all nodes.
Here’s one of the queries being used:
irate(container_cpu_usage_seconds_total{namespace="$namespace", pod_name=~"cassandra-sfs-.*", container_name="cassandra", cluster=~"$Cluster"}[1m])A single composite is used like this:
Hovering over one of the clusters will show the metrics:
The polygon displayed now represents the “worst” state of the cluster, considering all metrics for each node.
Seeing one polygon is not as useful as seeing all Cassandra clusters.
We’ll use template variables next to make this easier to maintain.
Rollup for Multiple Clusters
Add the following template variable:
label_values(kube_pod_container_info{namespace=~"metrictank"}, cluster)Under Selection Options enable Multi-Value.
Next adjust the queries so the cluster is used as a parameter:
irate(container_cpu_usage_seconds_total{namespace="$namespace", pod_name=~"cassandra-sfs-.*", container_name="cassandra", cluster=~"$Cluster"}[1m])Also set the Legend to:
{{cluster}} {{pod_name}} CPURepeat the same changes for each query.
Lastly, add a composite for each cluster. (This will be easier to do soon!)
Also update the default clickthrough to be:
dashboard/db/polystat-part-2-drilldown1?var-namespace=metrictank&var-Cluster=${Cluster}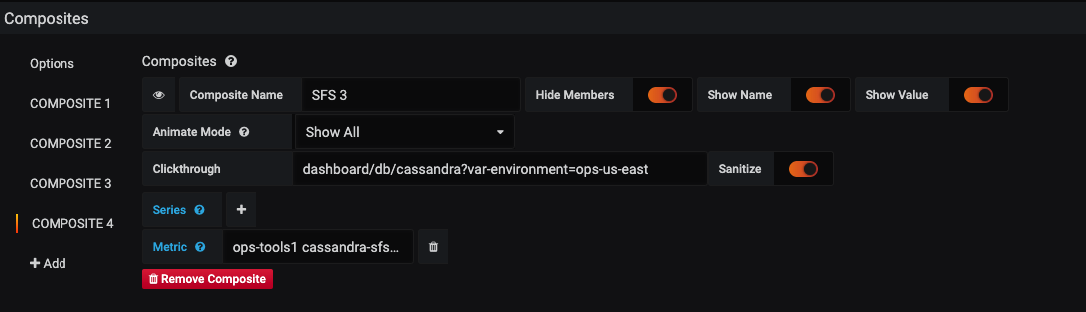
Now when you select multiple clusters at the top, you will get a rollup for each cluster:
Bringing it All Together
The overall idea is to provide a top-level view of all Cassandra clusters with the ability to drill down to a dashboard with more details (in this case another polystat-based dashboard).
To get to the next dashboard, update the default clickthrough:
dashboard/db/polystat-part-2-drilldown1?var-namespace=metrictank&var-Cluster=${Cluster}Create a new dashboard. Note: A copy of Part 1’s final dashboard can be used or download the example files.
Update the default clickthrough in this new dashboard to point to:
dashboard/db/polystat-part-2-drilldown2?var-namespace=metrictank&var-Cluster=${Cluster}Modify the metrics to include the cluster name.
Modify the composites to include the cluster name.
Lastly, we’ll update the composites again in the drilldown to go to another dashboard with more detailed metrics.
As a bonus, one of the nodes will go to a different detail dashboard by adding a clickthrough in COMPOSITE4
dashboard/db/cassandra?var-environment=ops-us-east

Panels!
These panels have been published to grafana.com and can be downloaded here:
- Basic Rollup
- Templated Rollup
- Drilldown to Polystat (templated)
- Drilldown to Metrics (templated)
What’s Next?
Tooltip Width
The tooltip may be too narrow to show all metrics in a single line. The ability to customize the width would be very useful. Automatic sizing would also be a good addition.
Template Variables in Composites
The example above demonstrates the need for template variable interpolation in a few places.
If composites can use a template variable as part of the name (or the name itself), the multi-selector will function correctly and each rollup will be labeled appropriately.
Automatic Composites
A popular request is to implement automatic composites. While building a composite from multiple metrics is easy for a basic panel, being able to dynamically build composites will make using polystat even easier (and less tedious).
Multi-Line Labels
Labels can be very long once you add tags. The ability to wrap them inside the polygon would be a great feature.
Multi-Line Metrics
Similar to labels, metric names can be very long. Both wrapping the metric name and splitting the value would be useful.
Sorting
This PR with more sorting options is ready to merge and provides better sorting, similar to other core Grafana panels.
Shapes
D3 comes with other shapes for polygons. Polystat only exposes two of them due to layout calculations.
Wrapping Up
Polystat is a very flexible “multi-stat” type panel that can be used for overviews and drilldowns. More features are being implemented and any ideas to enhance it further are welcome.
Be sure to share your Polystat dashboards on grafana.com!
