Tinder & Grafana: A Love Story in Metrics and Monitoring
Tinder is the world’s most popular dating app, with more than 26 million matches made each day. But two years ago, when it was time for the L.A.-based company to find and implement a perfect metrics monitoring partner, the process proved to be more slow-burn love affair versus whirlwind romance.
“They say Rome wasn’t built in a day. Same could be said for Tinder’s Grafana infrastructure,” Tinder Observability Software Engineer Wenting Gong told the audience at Grafanacon 2019 in L.A.
Since it was founded in 2012, Tinder has grown to more than 320 employees and utilizes Grafana to monitor hundreds of microservices as well as the containers inside its Kubernetes environment.
Here’s how Tinder’s relationship with Grafana evolved.
First Impressions: Swiping Right on Grafana
In 2017, Tinder had about 50 microservices running on Amazon EC2 instances, supported with CloudWatch monitoring and Elastic load balancers. The Cloud Infrastructure Team came together with the Observability Team to start building an internal infrastructure that monitored the overall health of all of Tinder’s services.
“Because everything was running on AWS, AWS CloudWatch could provide those helpful metrics,” said Gong. “Grafana is a very popular open source tool for the data analytics and visualization for applications and infrastructure, so they decided to enable our CloudWatch on those instances and on the Elastic load balancers and the auto-scaling groups as well.”
By pulling metrics from the CloudWatch data source (which is native to Grafana), Grafana allowed engineers to view and check their service metrics directly and created a centralized location to access real-time metrics. In short, Tinder liked Grafana’s profile, swiped right, and enjoyed its early interactions with the monitoring system.
Meeting the Family: Introducing Prometheus
It didn’t take long for Tinder’s backend engineers to decide to get to know Grafana better too. They wanted to use it for monitoring the efficacy of their services, creating dashboards to track P95 latencies or request status updates.
When looking at the scope of time series database options, the Cloud Infrastructure Team investigated OpenTSDB (“It requires Hadoop, which didn’t fit our scenario,” said Gong), Graphite (“It’s hard to scale for an open-source solution”), InfluxDB (“Its clustering feature is available as a paid version”), and Nagios (“It’s one generation old”).
“Prometheus comes without any of those outstanding drawbacks, and it provides great client libraries so developers could use this to expose their application metrics from their code directly,” Gong said. “So Prometheus was the best option for us.”
A single Prometheus server was launched to pull metrics for all of Tinder’s services, and Grafana was used to monitor service-detailed market metrics as well as CloudWatch house metrics. But the honeymoon phase didn’t last long.
Within a few months, backend engineers were finding that data was being dropped from time to time as Tinder’s business continued to grow at a rapid rate. One Prometheus server was just not enough to carry the load of the dating app’s booming services.
The solution was to create a more scalable infrastructure that involved assigning individual Prometheus servers to each service within Tinder’s suite and creating a separate dashboard on Grafana for individual services. Not only did this solution make it easy to scale an individual Prometheus server based on a service load, but “with different Prometheus servers and recording rules enabled, this infrastructure also enhanced the current performance for those frequently used expressions and those computationally expensive expressions,” said Gong.
Getting Serious: Committing to Long-Term Data
As monitoring proved to be of value to Tinder’s business, the Backend Team wanted access to metrics for longer periods of time.
“We were only keeping metrics for several days for each individual service,” explained Gong. “But [engineers] still wanted to check some historical metrics for important data.”
There were two options to solve this problem. “One was to increase the retention period for all of Tinder’s Prometheus servers, which is super easy,” said Gong. But because not all data was needed for long-term retention, “the money and resources would be wasted on unnecessary metrics.”
The Observability Team then suggested launching a separate Prometheus server strictly for archiving key metrics, which engineers could readily access as needed.
The newly created server would pull metrics from all the individual Prometheus servers and expose itself as a separate data source on Grafana. “Also we have the data auto-discovery service running inside this archive server so that whenever a new service came up or one got removed, the data source, targets and endpoints will always be updated on the archive server side as well as the Grafana side,” said Gong.
“Even though this way requires the extra setup and the module owners need to understand and update the existing configuration,” Gong added, “this helps us use the resources and the budget in a more efficient way.”
Moving in Together: Migrating to Kubernetes
As Tinder’s microservices started to add up to the hundreds, the Cloud Infrastructure Team decided it was time to move to a Kubernetes environment, which would help engineers deploy and manage applications at scale. “This way, it will help give our developers more velocity, efficiency, and agility, and it will also help us save some money,” said Gong.
As a result, the Observability Team had to figure out how to execute and support the current monitoring infrastructure within Kubernetes, which involved different services running in different namespaces for different clusters.
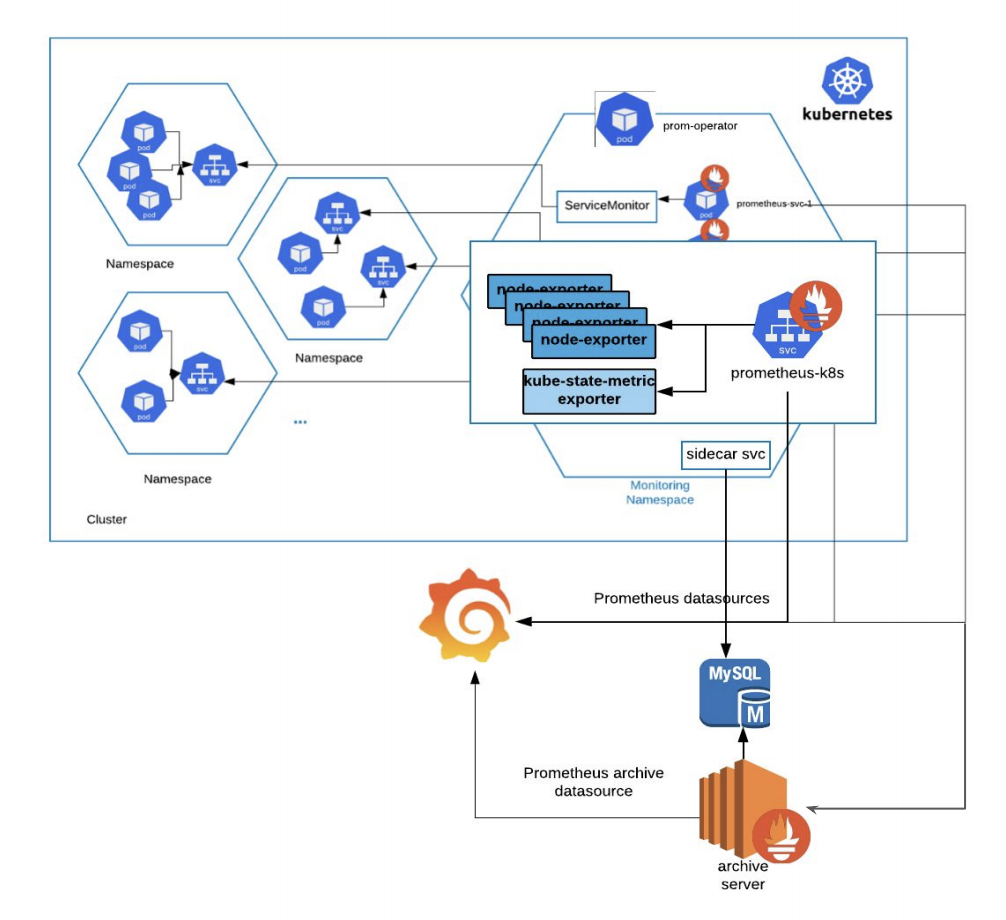
Because developers are already familiar with using Prometheus to expose application metrics, it didn’t make sense to implement a new system. Instead, Tinder launched the Prometheus Operator inside its monitoring namespace which manages, creates and configures Prometheus instances within the Kubernetes environment. “The service monitor will help select the targets we’re trying to monitor, and the Prometheus service itself will pull the metrics from those service monitors,” said Gong. “This Prometheus service endpoint is also exposed as a separate Prometheus data source to Grafana.”
Within the monitoring namespace, there is also a separate sidecar service set up specifically for the archived metrics to collect the Prometheus data and put them into a separate MySQL database. “The archive server, which is in a traditional EC2 instance, will go and check those database results, pull those target metrics in, and expose itself as a separate Prometheus archive data source,” said Gong.
And what if there are any emergency issues in the Kubernetes environment? The Observability Team set up a monitoring system for the Kube cluster itself. “We launched some node exporters, a kube-state-metric exporter in that monitoring namespace and used a separate Prometheus cadence to pull those Kube-related metrics in,” said Gong. “This Kube-related cadence is also a separate data source for Grafana to plot the graphs related to the Kube states.”
Tinder also uses Prometheus exporters to monitor other infrastructure components such as Elasticsearch and Kafka.
With Tinder’s infrastructure settled into its Kubernetes environment, engineers can now easily monitor test environments. “But it’s a headache for our engineers to duplicate those dashboards for different environments for the similar modules,” Gong said.
To reduce the manual creation work, Tinder uses many of the APIs supported by Grafana. Said Gong: “We went ahead and developed customized dashboard automation utilities, with the help of GrafanaLib, in Python using an HTTP client-wrapper that will help when duplicating similar dashboards for different clusters and for different environments.”
In short, it’s a relationship built to last.