Visualizing the Future with Grafana

Max von Roden [left] and Steffen Knott - Energy Weather
You’ve used Grafana to visualize what’s happened in the past, or what’s currently happening. But what about what might happen in the future? Steffen Knott and Max von Roden gave a talk at GrafanaCon 2018 about how they’re doing just that at Energy Weather.
Though the German company does employ meteorologists, “it isn’t exactly a weather service,” said Knott. “You can think of us as a translator between weather and the energy business. Our job is to reduce complexity and provide specific information, such as wind power forecast for a specific region, or a quantification of risk, like a sudden drop of temperature that affects energy markets.”
The energy business is complex, and there are many different ways that weather can impact it. “Nearly every weather condition can cause reactions on both the supply and demand side of the energy market,” said von Roden. Energy Weather uses Grafana visualization “to make it easy to understand,” said Knott. “Our meteorologist has a creative mind, and his ideas challenge us to use many of the exciting features of Grafana.”
Working with Weather Forecast Data
Energy Weather’s backend system, where all the data processing and computing are done, is written in C#. The team uses several forecasts from weather models, typically looking ahead 16 days, with a resolution of 1 to 12 hours. The information is in the form of gridded forecast data sets that contain values for each grid point around the globe, with the spatial resolution between each grid point about 4 kilometers.
“These datasets are unpacked, imported, maybe interpolated, and we then use them for our internal forecast processes, and these processes output time series,” said Knott. “We use these time series to create customer specific output files mostly in some more or less weird CSV format.”
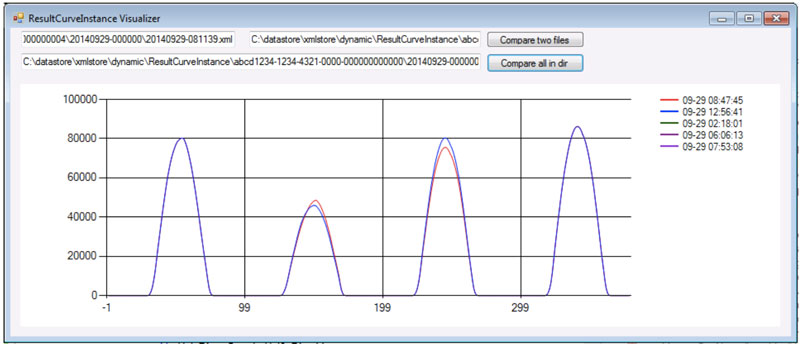
Graphs before Grafana
That is, until 2015, when Knott first discovered Grafana at a Chaos Communication Camp near Berlin. “I immediately thought, ‘Well, that’s it,’” said Knott. “We had been looking for a visualization solution for in-house analysis of forecasts for quite a long time.”
Before the camp ended, Knott’s team had installed Grafana along with InfluxDB as a database backend. “When Robin our weather guy saw Grafana running, it kept him smiling for days,” he said.
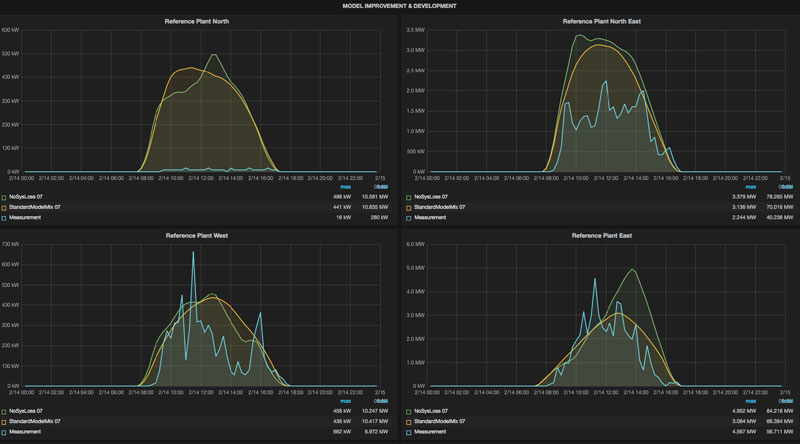
The first Grafana dashboard!
The first Grafana dashboard used at Energy Weather showed the company’s internal analysis of forecasts for photovoltaic power plants. “It shows the forecast along with measurements we received afterwards,” said Knott. “You can see the clouds passing by if you look at the blue line which shows the measurement. For plants with next-to-real-time measurement data feeds, this allows even for real-time monitoring or next-to-real-time monitoring of the forecast. You can evaluate it, and you have instant feedback, which is really great.”
The Challenges of Data Volume
Though Grafana provided a vast improvement over their previous solution, the team still had to investigate whether there would be any performance changes as more and more data was added into InfluxDB. “There is a significant difference between how time series are used in monitoring, and how we use them in forecasting,” Knott explained. “For monitoring, if you look at CPU usage for a specific core, you have one long time series that spans over a long, long time, with values that might have a resolution of five minutes, one minute, or one second or so.”
But for forecasting, for example, looking at the temperature for a specific location requires a time series that spans over the next 14 days, in 15 minutes or 60 minutes resolution. New forecasts are calculated every hour, and each time, that data has to be added to the database as a new time series. The old ones aren’t overwritten, because some applications need to look at the difference from one forecast to the next, for the same point in the future. This adds up to 10,000 time series added to the database an hour, 140,000 a day, about 7 million a month.
At the beginning, “we had strict retention policies in place that would keep the database light. Every now and then we dropped time series that we didn’t need anymore by hand to keep the system responsive,” said Knott. But the team has found that performance has “improved a lot over the years, so thanks to the Influx guys, that saved us some time.”
At the same time, the Energy Weather team has found that every update to Grafana offers new possibilities. “It became more and more clear that it could be used for so much more than just internal analysis of forecasts and comparing it to measurements and so on,” said Knott.
All the Pretty Dashboards
Over the past few years, the company has begun offering Grafana as a frontend solution to customers, with about 130 easy-to-understand dashboards using the new light theme.
The first dashboard the speakers shared is used by producers of power, or grid operators, and shows the current and expected renewable energy production for the German grid.
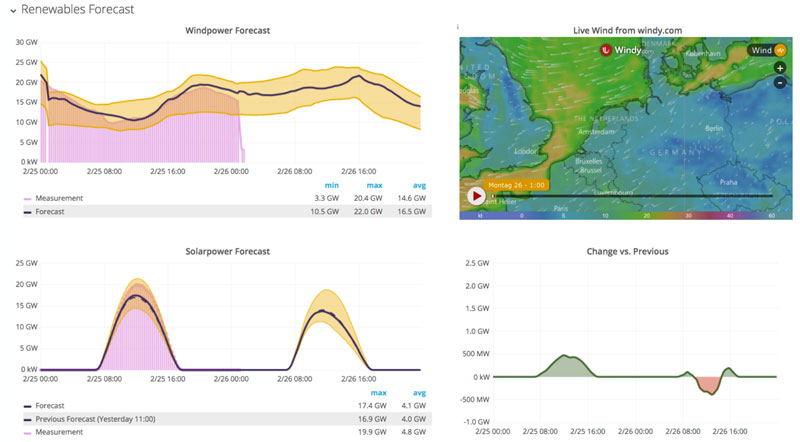
Rewnewable energy forecast graphs
“On the top left, the dark line shows the current wind power forecast,” said von Roden. “As forecasts aren’t always spot-on, we provide a yellow colored range for the most likely outcome of the forecast. The bar chart in pink shows the measurements that are provided in new time and sometimes real time, by the grid operators usually. You see it’s very close to the forecast, which was good.”
The team also added other information to the dashboard:
- In the text panel on the right, an animated bitmap from windy.com
- On the bottom left, the photovoltaic forecast seen in the same format
- On the bottom right, the difference from the previous forecast
“The combined wind and photovoltaic generation was nearly 20 gigawatts on average on this day; that is nearly one third of the usual demand in a winter month in Germany,” said von Roden. “On a sunny and windy day in February, maybe every third power plant might not be needed. So a dashboard like this helps suppliers optimizing generation planning, or at least show risks for possible plant down times. In short, there is an impact on the supply side.”
The second dashboard showed the temperature forecast for France using four common weather models. Temperature is the most important parameter for the demand side of the energy market.
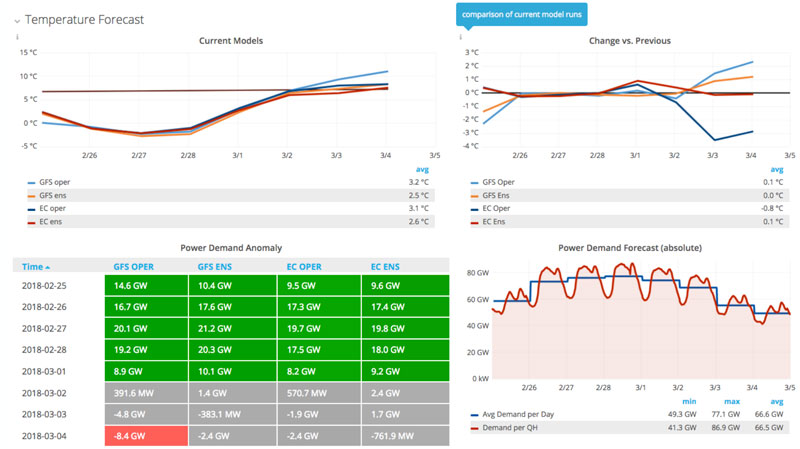
Temperature forecast graphs
“The black line in this chart shows a long-term average temperature, and this is important because demand expectations usually are based on long-term averages,” says von Roden. “As you can see, the temperature is much colder than expected in the first days. If this information is not enough for proper planning, our backend translates it into how the power demand will change.” This information is shown in the table on the bottom left of the dashboard. On the bottom right, a chart shows the power demand forecast in daily and hourly resolutions.
Applying the Data
With all the weather and energy data in its database, Energy Weather produces customized market overviews and price forecasts.
Using Grafana table panels, the team created a dashboard that shows an hourly price forecast and the models used. The forecast can be seen in green, and the final price provided by the exchange is in red.
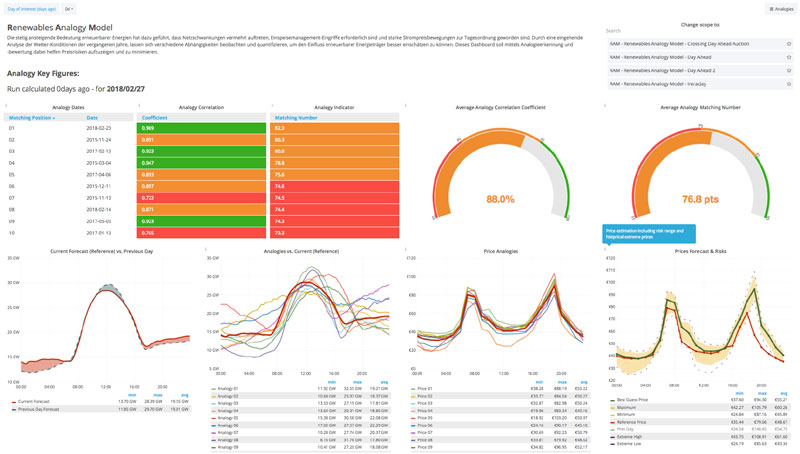
Renewables Analogy Model
Another dashboard shows the price changes using Grafana tables.
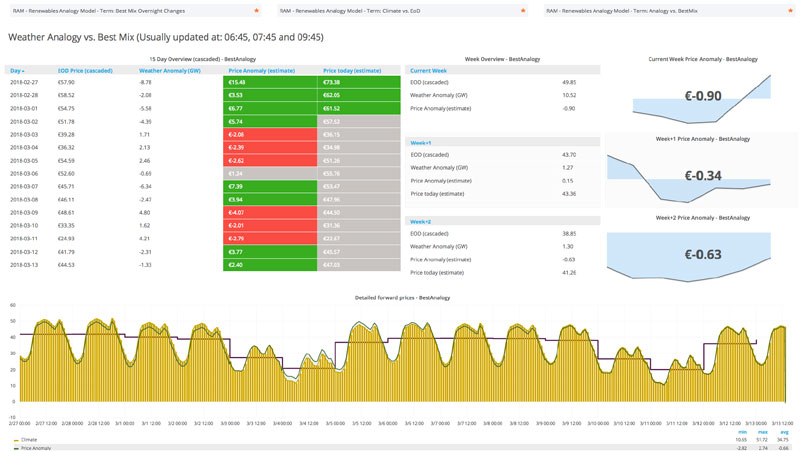
Weather Analogy vs. Best Mix
“We use the sparklines to visualize the development along with an average price for the upcoming weeks,” said von Roden. “We like these sparklines, which are an amazing simplification of visualizing something. And it’s all together in one aggregated dashboard: There’s a change of weather, translated into a change of power; and demand and supply combined, transformed into an estimated price change in the next weeks.”
It’s an unusual use case for Grafana, von Roden said, but “Grafana can indeed be used to look into the future!”

