Closer look at Grafana's user interface for Loki
Introduction
At Grafana Labs we run a plethora of microservices for our hosted offerings. We’ve been very happy with our monitoring with Graphite and Prometheus, and our distributed tracing using Jaeger. But we have had a difficult time finding a log aggregation system that fits our needs. Existing solutions offered lots of features, but those same features somehow got in the way of finding logs quickly. We decided to build our own simplified log aggregation: Loki. It is designed to be lean in the backend. In addition, we tried to pair this with a clean and intuitive way to read your logs inside Grafana. This post details some of the UX goals we had to deliver logs simpler and faster.

No pagination

Pagination splits up content across multiple pages. The result is that you are allowed to see only so many log lines as to fit on a page, whether that is 20 or 50, or 100. To see more lines, you need to go to the next page, and wait for those results to load.
There are three problems with this approach. The first one is that it assumes that log lines are read individually, and that after you read the 20 or so lines, you move to the next set. This neglects the fact that we as humans are great at pattern recognition. Log outputs have rhythm and structure. A healthy log output may look like a healthy electrocardiogram. Pagination interrupts multi-line patterns and makes it harder to spot the hiccups you are looking for. Just like you don’t look at every c-h-a-r-a-c-t-e-r of a word to identify it, you don’t need to look at every log line to spot at pattern.
The second problem is delay. Every time I advance a page, a request is sent to load a new set. And since that request returns a similarly small set of lines, chances are that I might have to request the next page again. The worst problem we found, however, was that pagination takes control away from the user. Your built-in browser search becomes much less powerful, if the rendered set of lines is small.
So what do we do instead? We return and render a decent number of log lines that is big enough to spot patterns as you scroll down. Since these logs are already loaded in the browser, they can be searched further using your browser’s search function. The default limit is currently 1000 lines, but is configurable.
Filtering log lines
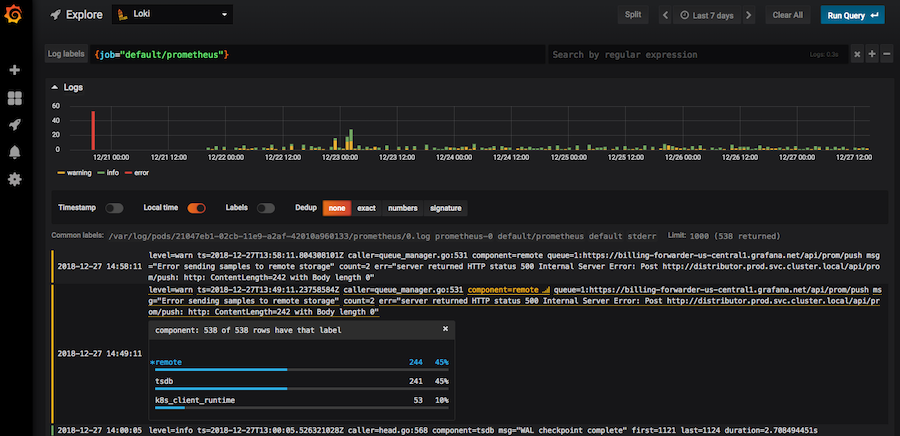
Without paging, you need to make sure what you are looking for is in the result set of the 1000 lines. You do this by filtering. The combination of time, labels, and a regular expression should be enough to return a decent result set to scroll through. A graph above the log results shows how many log lines coloured by log level for the given query are seen over time. If you see a spike, you can use the graph to further zoom in based on patterns you in the graph.

The query field can take a proper regular expressions and its matches are highlighted as you type.
This is useful when you are testing various expressions to further filter the existing results.
When the query is run again, only matches are returned to get even more meaningful results.
Ultimately, we would like the user to be able to select multiple log streams (just like they can graph data from multiple datasources in Grafana), multiplex them into a single stream, and then allow chained filtering, similar to the classic logging grep use case: ... | grep foo | grep -v bar.
Ad-hoc statistics
Doing statistics across log lines is great for spotting unhealthy behavior. For example, if your database cluster has 3 read-only nodes but only 2 are serving requests, something is up. In busy log lines, that pattern is hard to spot.
We believe that 1000 lines may just be enough of a data set to run such an analysis on.
We have implemented a handful of parsers to extract fields from log lines, e.g., instance=foo_1 status=400 ....
This allows us to build dynamic field matchers on demand to gather the distribution of field values across the set of lines, e.g., instance is foo_1 on 55 % of the lines that have the field instance.

Since we are calculating the statistics on the result set that is already in the browser, the results show up instantly.
It is worth noting that good filtering is important to maximise the number of lines that have the field present that you want to match against.
We’re extending the parse and match logic to also allow drawing graphs based on number values, e.g., if your log lines contain something line duration=11.3ms, this should be graphable as an ad-hoc time series.
Performance
Rendering 1000 lines is not easy on the browser. It takes roughly 500 ms during which the main thread is blocked and the browser can feel frozen. To keep the page interactive, we’re using a staged approach. First, the graph is rendered to give a quick overview of the log line distribution over time. Then the first 100 lines are rendered, which should cover the complete screen a few times over. This is to ensure that we quickly render meaningful logs “above the fold”. After a further delay, the remaining lines are rendered, to allow scrolling and in-browser search on all the results. Note that the line limit is configurable in the Loki datasource, in case you want to adjust the number according your browser’s performance.
Explore and Split view
Grafana’s user interface for Loki is part of a new Grafana feature called Explore. Explore got started with a more query-oriented workflow around troubleshooting with Prometheus metrics.

Once you have refined your Prometheus queries to show the unhealthy behavior, you will likely have identified a service and/or an instance that is acting up.
This is where Loki comes in.
Loki uses the same selector logic as Prometheus.
Consider a Prometheus query like http_requests_total{job="app-server",instance="app1",route="/foo"} that you may have used to identify a faulty instance.
When switching to Loki, it reuses the relevant selector labels for which logs exists, e.g., {job="app-server",instance="app1"}.
Notice how it automatically dropped the route label and the metric name.
Thus, using Explore’s Split view, you can have Prometheus and Loki, showing you related metrics and logs side-by-side.
Conclusion
Loki and Grafana are a perfect match. The backend is kept lean and space-efficient, while the user interface allows ad-hoc field parsing and simple statistics. For now we will not be able to answer question like “Top n of X” across a long time range, but we still believe that the tradeoff is a very useful one for troubleshooting. It’s still early days, so please give it a try, provide feedback on GitHub, or contribute so we can make this even better for everyone.
Loki can be run on-prem or as a free demo on Grafana Cloud. Visit the Loki homepage to get started today.

