

Pro Tips: Using Prometheus and Grafana for Monitoring Power Usage
 Erwin de Keijzer - Snow
Sure, thousands of technologists around the world are using Prometheus and Grafana to monitor their business systems. But how about putting these technologies to work at home?
Erwin de Keijzer, a Linux engineer at the Dutch consulting firm Snow, gave a talk at GrafanaCon EU about how he used Prometheus and Grafana to monitor the power usage… of his washing machine. “This is a talk that’s a bit different scale than we’ve heard so far” at GrafanaCon, he quipped.
Spin Cycle
Erwin had a problem that might sound frustratingly familiar to many of us: The timer on his washing machine wasn’t accurate. “I come back two minutes after it should be done, and it’s 15 minutes left,” he said. “I come back 10 minutes later, and it’s still 10 minutes left…. It’s almost half an hour after it should have been done.”
So what’s an engineer to do? “I thought about putting a camera in there or buying a new washing machine that has an API,” he said. “But I’m also cheap, so I wanted to do it with stuff I had lying around already. So I thought, let’s get some monitoring on my power usage and determine if I can see from the graphs that come out of that if my washing machine is done.”
Erwin, who lives in the Netherlands, connected his Raspberry Pi Zero to his smart energy meter with a USB2 P1 cable, which enabled him to gather all of the data that the smart meter collected onto his Raspberry Pi. He wrote an exporter in Go using the promhttp library to get the data from the P1 port, store it, and expose the metrics to be scraped by Prometheus.
In his presentation, Erwin showed the graphs from his smart meter. “You can see some peaks. I’m using four kilowatts [here]. That’s probably because when [the washing machine] turned on, that uses three kilowatts,” he said. “There’s some more going on, I’m not sure what it is. So I put Prometheus on the other Intel NUC that I had lying around. So you have the gathering, but the visualization of Prometheus is not stored, so here comes Grafana.”
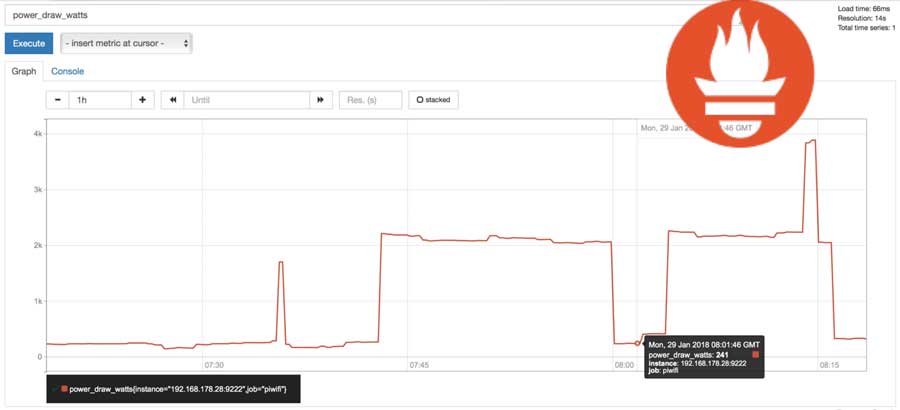 Default Prometheus graph showing the 4Kw peak
Enter Grafana
With Grafana, Erwin made some graphs to show his gas usage versus the temperature. “I was interested if it’s very cold outside, do I use more gas?” he said. (Turns out, there was no correlation.) “I also wanted a method of looking at those graphs I created with Grafana, so in comes Caddy.” Caddy is an open source project that enables a web server with TLS encryption.
So did the graphs show him when his washing machine was done? “The graphs are not linear,” he said, with some disappointment. “There’s not a clear cut-off point of when it was done. So I basically failed at getting notifications when my washing machine was done.”
That said, he did have two interesting graphs about his power usage, and with those graphs, he was able to glean some insights.
Is Your Refrigerator Running?
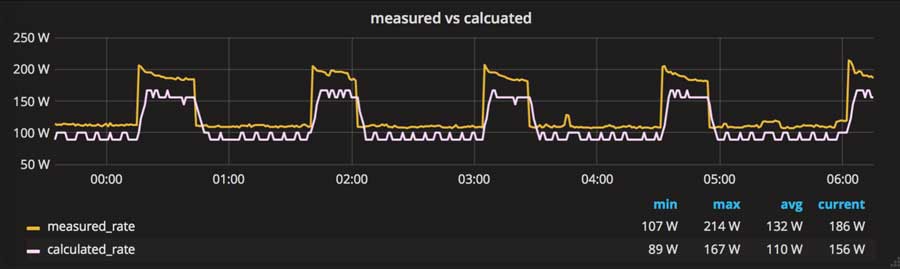
The first graph showed the current draw and the meter reporting. “With Prometheus it is possible to do a derivative of your graph, so this [graph] is the comparison between what the meter is reporting, and what the current draw is, and as you can see they do align,” he said. “There’s a small difference between them, which also makes sense because the smart meter only reports its values every 20 seconds.”
 Current draw vs what the meter reports
The graph, interestingly, showed some peaks at night, every 60-90 minutes. What was drawing power at night? His refrigerator. “At one point I was up at night and I heard it turn on,” Erwin said. “I was like, ‘Oh, let’s check [the graph] on my phone.’”
The second graph of note showed the off-peak and peak measurements. “I found out that I have two meters, and on the weekends it’s all off-peak,” he said. “I also noticed Christmas is off-peak. Apparently January 1 is off-peak. So I now have insights into when I save money and when I don’t save money.”
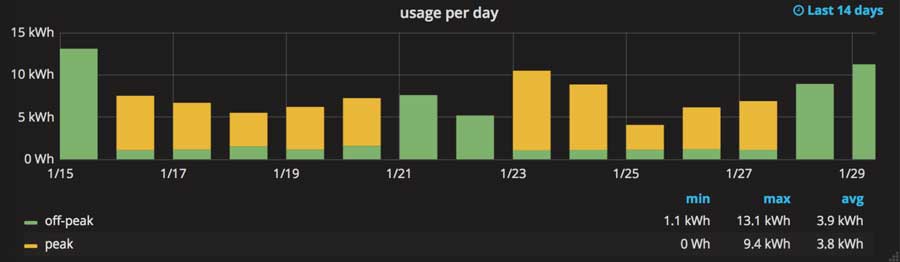 Peak vs off-peak usage
Though he still has to get up and go to the laundry room to check if his washing machine is done, Erwin now has a secure, private web interface for exploring his power usage. If you’re interested in setting up your own power usage monitoring, you can find him on Twitter and Github.


