

Grafana’s Explore UI: Taking a Deeper Dive into Data with Prometheus Queries
 David Kaltschmidt, Director, UX - Grafana Labs
When there’s an incident, Grafana is often the starting point for figuring out a response. Users look at a time series panel and form a hypothesis. And in many situations, they’d like to dive deeper.
To help make that easier, Grafana Labs has created the Explore UI, which allows you to iterate quickly through Prometheus queries, while leaving your dashboards intact. “Grafana is currently on a journey to transition from dashboarding solutions to an observability platform,” Grafana Labs Director, UX David Kaltschmidt explained during his presentation at PromCon in August.
Explore UI was designed to fit into workflows for both troubleshooting and data exploration. And with Prometheus as a data source in 54,000 of over 186,000 Grafana installations—a 3x increase over last year—it made sense to focus on Prometheus queries first.
“We wanted to bring a lot more interactivity to queries and to Grafana,” said Kaltschmidt, “and we iterated a bit and came up with this more query-centric view, as opposed to the classic Grafana dashboards, which are more about visualizations.”
There’s now a new Explore icon in the panel menu of Grafana. This new section, which Kaltschmidt demoed at PromCon, focuses on the queries themselves. “For Prometheus specifically, we want to make the things that should be easy a bit easier,” Kaltschmidt said. “So for example, there’s a little metrics explorer here which groups the available metrics by prefix, so you can have your Alertmanager-related metrics here, and then you just click one, and it fills it out. That’s pretty cool. And then it’s like, hmm, this is a time series that’s monotonically increasing, maybe we should apply a rate function, so then you just click this button, and boom that works." Especially these last query hints will play a big part in making Prometheus more approachable for novices.
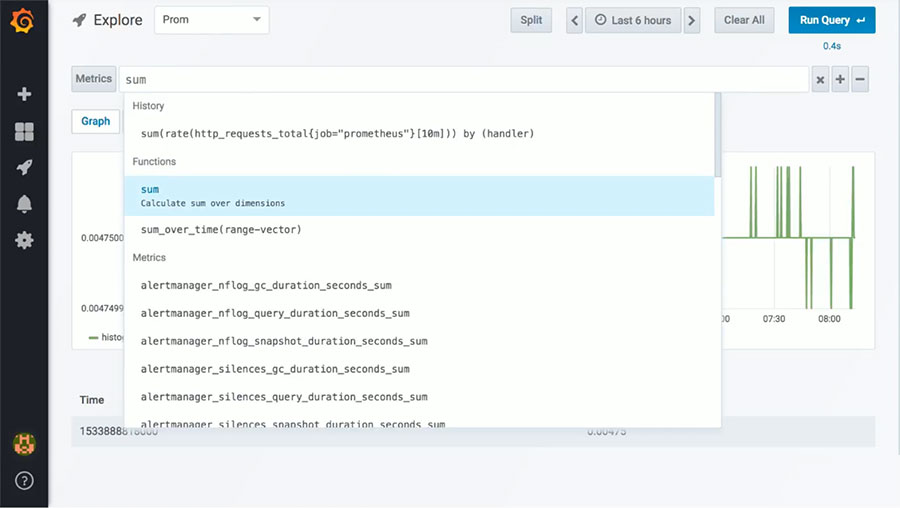 New Explore UI interface
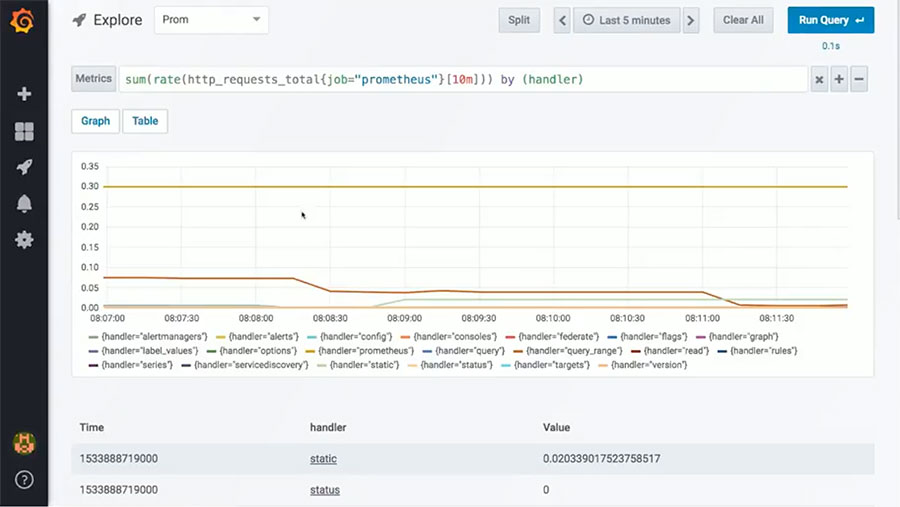
Kaltschmidt then showed how the same could be done for anything with buckets. Explore can fill out “what we hope is a good default function call for your buckets,” he said, by wrapping the expression with the correct histogram function and its parameters. These resulting expressions are meant to be quick starting points, which you can then iterate through queries.
A history was added, so that you can see information such as the last things you queried, how often they’ve been queried in the last 24 hours, and how long ago that was.
“It always executes two queries, one for the instant query for the table, and one for the graphs,” said Kaltschmidt. “You can also toggle the graph, and then you just see the table if you want to iterate more quickly.” It only takes one click on a label to filter by it and drill-down.
We’re already supporting a brand new feature of the Prometheus API: recording rules, which means we have their definitions available in Grafana. “If you want to start debugging a query that also contains recording rules, you can expand the rules and do this for all the recording rules that are in your query, in case you’ve forgotten what you’ve written there.”
A split view allows you to compare different Prometheus instances, for example, Dev vs. Prod. And multiple queries can be displayed in the same graph.
The last part of Kaltschmidt’s demo showed a faceted search within a query. Starting with a long list of jobs you can select a job, e.g., Alertmanager, and “this basically helps you find out what actual queries are available by the Alertmanager job,” he said. “Then you can look for a metric here, and it totally zones in on the labels that are available based on the previous selectors. So you only end up with suggestions that make sense to everything that came before.”
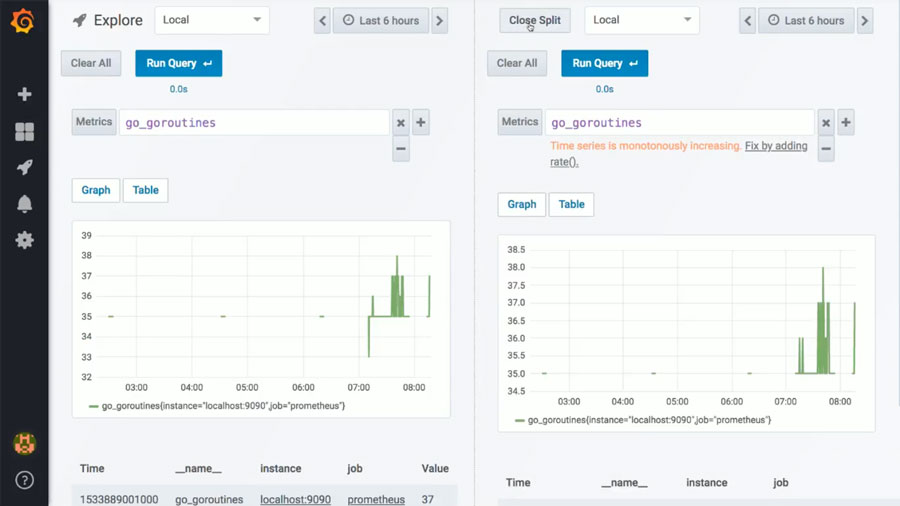 Split view and multuple queries on the same graph
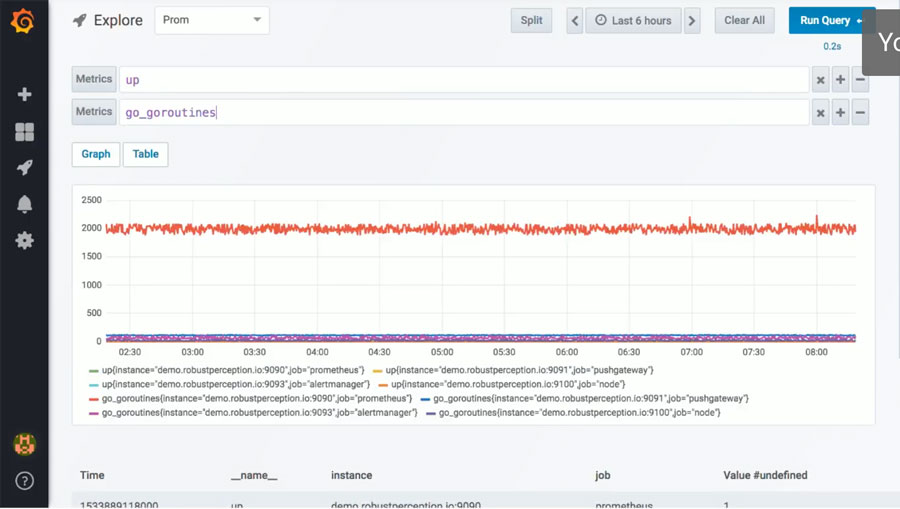
Explore UI is still “super alpha,” Kaltschmidt concluded, but it’s behind the feature flag, and can be accessed if you’re using the latest Docker image. It will likely be released with Grafana v6.0. There are still things that need to be refined: “Support for completion needs a bit more work. We want Prometheus metric metadata from HELP line in the exposition. The Prometheus exposition format has this help text around what a query does, and when the ‘Write-ahead lock’ stuff is implemented, we can possibly show these query metadata, time series metadata also in the UI. That will be pretty cool.”
To enable, simply edit the Grafana config ini file:
[explore]
enabled = true
Then set up a datasource that supports Explore, e.g. Prometheus, and you’re ready to go… Explore. Feedback is welcome (@davkals)!
Watch the live demo:
[Download the presentation slides](https://promcon.io/2018-munich/slides/explore-your-prometheus-data-in-grafana.pdf)