

timeShift(GrafanaBuzz, 1w) Issue 56
Welcome to TimeShift
PromCon was held this week in Munich, Germany, and Grafana Labs was excited to both sponsor and speak at this great conference. If you didn’t have a chance to attend, you can watch a recorded livestream of the event and download slides in the blog roundup below.
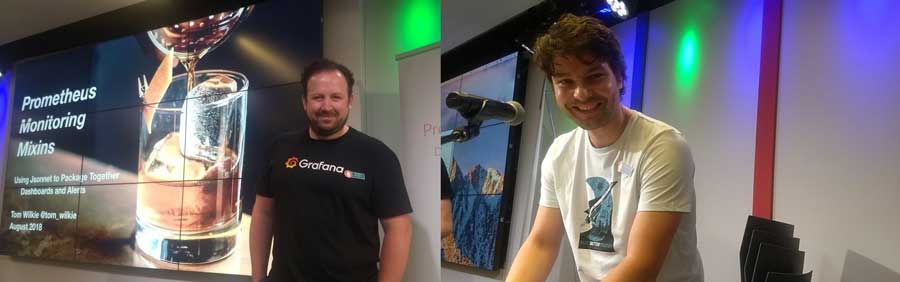 Left to right: Tom Wilkie and David Kaltschmidt prepping for their talks
We’d also like to congratulate the Prometheus project for moving from the incubation stage to graduation as an official CNCF project!
Hope you enjoy this week’s roundup of articles and plugin updates. If you see an article you think might be a good fit for an upcoming issue of TimeShift, please contact us.
Latest Stable Release: Grafana 5.2.2
Bug Fixes
- Prometheus: Fix graph panel bar width issue in aligned Prometheus queries #12379
- Dashboard: Dashboard links not updated when changing variables #12506
- Postgres/MySQL/MSSQL: Fix connection leak #12636 #9827
- Plugins: Fix loading of external plugins #12551
- Dashboard: Remove unwanted scrollbars in embedded panels #12589
- Prometheus: Prevent error using $__interval_ms in query #12533, thx @mtanda
See everything new in Grafana v5.2.2.
Download Grafana 5.2.2 NowFrom the Blogosphere
David Kaltschmidt: Exploring your Prometheus Data in Grafana: David has been working tirelessly on the new explore UI for Grafana. We’ll link to the video once it’s available, but for now he’s made his slides available so you can learn about it, and find out how to enable the feature in the latest version to give it a try.
Tom Wilkie: Prometheus Monitoring Mixins - Using Jsonnet to Package Together Dashboards, Alerts, and Exporters: Tom discusses a technique for using Jsonnet for packaging and deploying “Monitoring Mixins” - extensible and customizable combinations of dashboards, alert definitions and exporters. This technique allows you to publish best-practice monitoring configurations alongside your code, and for users to consume it, customize it and stay up to date. Also, check out the video of his presentation.
Using TimescaleDB + Prometheus to Monitor and Troubleshoot CockroachDB: Diana, who recently joined the Timescale team outlines how to combine four open source technologies to create a powerful monitoring stack, and provides a high-level tutorial on getting everything set up.
Inside Fortnite’s Massive Data Analytics Pipeline: Fortnite is a truly massive MMPG with over 125 million users spanning the globe. But pulling together all the servers, databases, and data pipelines to manage 92 million events per minute is no small feat. This article gives you a rundown of their systems, how they keep them running, and what they’d like to optimize in the future.
Managing your Costs on Kubernetes: Cost is often a factor when discussing migrating to a public cloud solution. When the sky’s the limit when it comes to resources, your monthly bill could be at risk of poking through the stratosphere. The article shows you how to use Prometheus, Grafana, and Kubernetes to create a dashboard that can help you get a better visualization of the cost of your applications.
M3: Uber’s Open Source, Large-scale Metrics Platform for Prometheus: Rob Skillington, staff software engineer on the Observability team in the Uber New York City provides a deep dive into M3, the metrics platform they’ve been working on for the past few years. In fact, at our very first GrafanaCon in 2015, Matt Mihic gave a talk about M3.
NetEye 3.14 and NetEye 4.2 Release Notes: The latest version of Würth Phoenix’s NetEye Unified Monitoring Solution has been released which includes Grafana 5 and allows you to take advantage of the new dashboard layout engine, folders, provisioning and more.

GrafanaCon LA
CFP Now Open!
Join us in Los Angeles, California February 25-26, 2019 for 2 days of talks focused on Grafana and the open source monitoring ecosystem.
Submit You CFP TodayGrafana Plugin Update
Two new panels to show off this week along with an update to the Clickhouse data source plugin. We’ve made it simple to update your plugins – for on-prem Grafana, use the grafana-cli tool, or for Hosted Grafana update with one-click at grafana.com.
WindRose Panel - This new panel was developed in a joint effort as part of a research project in Taiwan. A wind rose is a graphic tool used by meteorologists to give a view of how wind speed and direction are distributed at a location.
LinkSmart SensorThings Data Source - This is a new panel that works with any server that implements the OGC SensorThings API. The SensorThings API is a standard for connecting IoT devices, data and applications over the web. An exciting feature of this is the ability to easily integrate into existing Spatial Data Infrastructures (SDI) or Geographic Information Systems (GIS) and means this data source works well with the Worldmap panel.
Check out their live demo dashboard to see what this data source can do.
Clickhouse Data Source - The Clickhouse plugin is being continually improved and the latest release now has support for annotation queries.
Another new feature is the addition of two new macros: $from and $to that can be used in templating queries. If you are using Grafana's provisioning feature there is now a config example included in the readme for the Clickhouse plugin.
We're Hiring!
We've added new open positions at Grafana Labs! Do you love open source software? Do you thrive on tackling complex challenges to build the future? Want to work with awesome people? Be the next to join our team!
View our Open PositionsUpcoming Events
In between code pushes we like to speak at, sponsor and attend all kinds of conferences and meetups. We also like to make sure we mention other Grafana-related events happening all over the world. If you’re putting on just such an event, let us know and we’ll list it here.

London Hashicorp User Group | London, United Kingdom - August 14, 2018:
Tom Wilkie: Monitoring the Hashistack with Prometheus - Prometheus has become the defacto monitoring system for cloud native applications, but for a while was eschewed by the Hashistack in favour of more traditional technologies. Thats all changing: Hashicorp's project are beginning to export metrics in the native Prometheus format, and many exporters exist to bridge the gap.
In this talk Tom will give a brief introduction to Prometheus, show you how to piece it all together, and give some recommendation on what to monitor and alert on.
Register Now
How to Use Open Source Projects for Performance Monitoring | Webinar - August 15, 2018 - 1pm EDT:
Check out how you can use 5 of the most popular open source projects, InfluxDB, Telegraf, Chronograf, Kapacitor and Grafana, for performance monitoring of your Infrastructure, Application, & Cloud faster, easier, and to scale. In this webinar, Leonard Gram from Grafana, and Margo Schaedel from InfluxData, will provide you with step by step instruction from download & configure, to collecting metrics and building dashboards and alerts.

2018 Sensu Summit | Portland, OR - August 22-23, 2018:
Brian Gann: The Sensu Plugin for Grafana - Brian will be showing a demo of the new Sensu plugin for Grafana on August 22, and conducting a 30 minute Grafana tutorial on the 23rd!
We are a proud sponsor of this year's Sensu Summit! Come enjoy Portland in the summer and learn a ton from the sharpest operations engineers in monitoring!
More Info
CloudNative London 2018 | London, United Kingdom - September 26-28, 2018:
Tom Wilkie: Monitoring Kubernetes With Prometheus – In this talk Tom will explore all the moving part for a working Prometheus-on-Kubernetes monitoring system, including kube-state-metrics, node-exporter, cAdvisor and Grafana. You will learn about the various methods for getting to a working setup: the manual approach, using CoreOS's Prometheus Operator, or using Prometheus Ksonnet Mixin.
Tom will also share some little tips and tricks for getting the most out of your Prometheus monitoring, including the common pitfalls and what you should be alerting on.
Register NowTweet of the Week
We scour Twitter each week to find an interesting/beautiful dashboard or monitoring related tweet and show it off! #monitoringLoveHallelujah! @grafana is making it easier to try out PromQL queries. Choose a drop-down of metrics, alerts, recording rules etc. Gives corrections. Tells you when you last used a query. Suggests labels. Split view, multiple queries per graph 😍😍😍 #promcon2018 pic.twitter.com/LYgBvtxuGa
— Emily Labram (@emilylabram) August 10, 2018
So glad to hear you're excited about the new explore UI. It's still pre-alpha, so there's lots more to come!
How are we doing?
Hope you enjoyed this issue of TimeShift. What do you think? Are there other types of content you’d like to see here? Submit a comment on this issue below, or post something at our community forum.
Follow us on Twitter, like us on Facebook, and join the Grafana Labs community.