The RED Method: How to Instrument Your Services
 Tom Wilkie - Grafana Labs
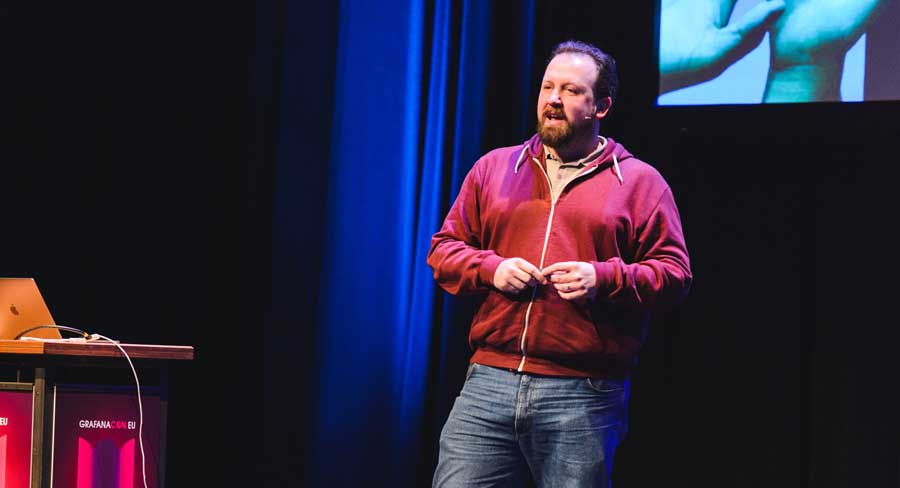
At GrafanaCon EU in March, we had the pleasure of introducing one of Grafana Labs’ newest team members, Tom Wilkie, who joined as VP, Product with the acquisition of Kausal.
And he came bearing gifts: his popular talk about the RED Method of monitoring microservices, which he created in 2015.
The USE Method
In the talk, Tom first went over the USE Method of instrumenting, which has been popularized by Brendan Gregg:
For every resource, monitor:
- Utilization (% time that the resource was busy)
- Saturation (amount of work resource has to do, often queue length)
- Errors (count of error events)
“It’s a way of building a checklist that goes through everything,” he said. “It helps you know what you don’t know.” But he pointed out that this method, while useful, is somewhat abstract. Applying it to memory, for instance, is hard. “Memory utilization is tricky. What is it? Do you count caches toward utilization?” he said. “Saturation of memory is kind of a weird one… And what is a memory error? And how do you count them in Linux?”
The RED Method
Tom then turned to his RED Method, which he created after a new employee asked what his monitoring philosophy was. “The USE Method doesn’t really apply to services; it applies to hardware, network disks, things like this,” Tom said. “We really wanted a microservices-oriented monitoring philosophy, so we came up with the RED Method.”
For every resource, monitor:
- Rate (the number of requests per second)
- Errors (the number of those requests that are failing)
- Duration (the amount of time those requests take)
(See his presentation slides on the Prometheus implementation of the RED Method)
“Everyone should understand the error rate, the request rate, and then some distribution of latency for those requests,” Tom explained. “You model this for every single service in your architecture, and this gives you a nice, consistent view of how your architecture is behaving. Giving this kind of consistency across services allows you to scale your operational team, and allows you to put people on call for code they didn’t write.”
Plus, he pointed out, “The RED Method is a good proxy to how happy your customers will be. If you’ve got a high error rate, that’s basically going through to your users and they’re getting page load errors. If you’ve got a high duration, your website is slow. So these are really good metrics for building meaningful alerts and measuring your SLA.”
The Four Golden Signals
Finally, Tom looked at a third method: The Four Golden Signals, which is from Google’s SRE book.
For each service, monitor:
- Latency (time taken to serve a request)
- Traffic (how much demand is placed on your system)
- Errors (rate of requests that are failing)
- Saturation (how “full” your service is)
This is basically the same as the RED Method, but includes saturation. He explained one approach to measuring saturation: “With kube-state-metrics, a little job you run on your Kubernetes cluster that scrapes the Kubernetes API and exports really interesting metadata about your jobs and services and pods and so on, you can compare the amount of CPU a service is using against its quota. Like how much it should be using, or how much is it allowed to use, as a proportion between 1 and 0. This gives you a measure of how ‘full’ your service is, or some proxy for how full your service is at least. And this is super useful because you could for instance build an alert on this.”
Two Sides of the Same Coin
Tom recommended using the USE and RED Methods together. “It’s like the RED Method is about caring about your users and how happy they are,” Tom said, “and the USE Method is about caring about your machines and how happy they are. It’s really just two different views on the same system. They’re complimentary.”
Watch Tom’s full talk in the video below.

