

Guest Blog Post: Ballerina Makeover with Grafana
In this guest blog post from the folks at Ballerina, Anjana shows you how you can easily visualize metrics from a Ballerina service with Grafana, walking you step by step through the installation and configuration of the components. They’ve also extended an offer for a free ticket to their upcoming Ballerinacon to the Grafana community.
[Ballerina](https://ballerina.io) is a cloud-native programming language gaining adoption in the microservice development world. Ballerina is a general purpose, concurrent, transactional, statically and strongly typed programming language with both textual and graphical syntaxes. It brings fundamental concepts, ideas and tools of distributed system integration into the language. These include distributed transactions, reliable messaging, stream processing, workflows and container management platforms. Ballerina is an open source project under the Apache 2.0 license and is developed by the Ballerina community.
Ballerina is observable by design; where this aspect is baked into the language runtime itself. The idea is to allow users to understand the state of your deployment at any given time, so you can predict the behavior and prepare any corrective actions for the system if necessary. Monitoring the metrics of your system is a prominent aspect of this, and having this data, without having a suitable way to visualize it, is almost useless. This is why Ballerina has chosen Grafana for this task, being the open source industry leader in analytics visualization.
Grafana is a feature rich time series data visualization and dashboarding tool that can visualize data from over 40 different sources, and through its plugin architecture can be extended to visualize data from even more data sources. Ballerina uses Prometheus for collecting the metrics, and we can run queries for additional time series operations and data transformations. And of course, Grafana has Prometheus support as a data source by default. I will be going through the steps on how to monitor and visualize a Ballerina service using Grafana.
#### Implementing the Ballerina Service Let’s look at how to write a simple Ballerina service, so we can monitor its invocation metrics. First, you'll need to [download and install Ballerina](https://ballerina.io/learn/#installation).
Create a Ballerina service as shown below, and save it as “hello-service.bal”.
import ballerina/http;
import ballerina/log;
service<http:Service> hello bind { port: 9090 } {
    sayHello(endpoint caller, http:Request req) {
        http:Response res = new;
        res.setPayload("Hello, World!");
        caller->respond(res) but { error e => log:printError(
                           "Error sending response", err = e) };
    }
}
The service is run with the following command:- $ ballerina run hello-world.bal --observe
Note: the “–observe” switch, which is used to enable the observability features of Ballerina, where, at the moment, it is disabled by default.
At this point, the service will start up, and will be ready to accept requests at http://localhost:9090/hello/sayHello. You should see the following output in the console:-
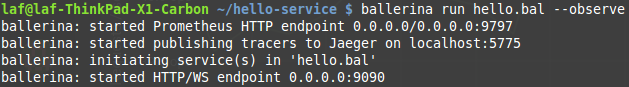
Starting the Ballerina service
You will notice that, it also logs the Prometheus HTTP endpoint, which is an internal service that is brought up to serve the Ballerina metrics to a Prometheus server. The next section will cover how the data is pulled by Prometheus.
#### Setting up Metrics Collection The metrics collection is done by Prometheus. For a quick installation, we will use Docker to run Prometheus. As a prerequisite, make sure [Docker is installed](https://www.docker.com/) on your machine.
The first step is to create a “prometheus.yml” file at /tmp, and add the following content:-
global:
  scrape_interval:     15s
  evaluation_interval: 15s

scrape_configs:
  - job_name: 'prometheus'
    static_configs:
      - targets: ['IP:9797']
Here, “IP” should be your IP address of the network interface; do not put the loopback address here. Basically, with this configuration, Prometheus will talk to the metrics endpoint that was initiated earlier by the Ballerina service. The above prometheus.yml is used to do a volume mount with the Docker instance, so Prometheus will pick that as the configuration file in the container.
Now, execute the following command to run Prometheus in Docker:- $ docker run -p 19090:9090 -v /tmp/prometheus.yml:/etc/prometheus/prometheus.yml prom/prometheus
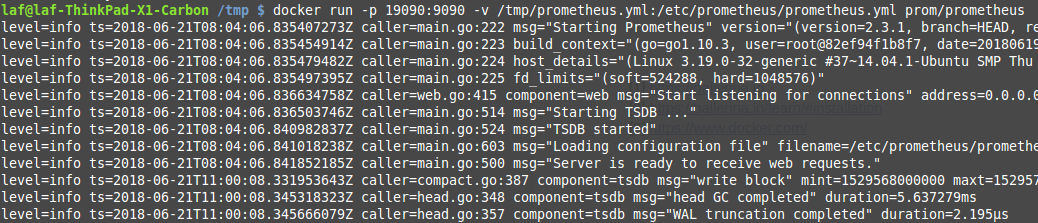
Running Prometheus in Docker
Now, Prometheus will poll for metrics data from the Ballerina service and store in its time series data store.
#### Visualizing Metrics with Grafana Now that we have a queryable data source with Prometheus, we can use Grafana to visualize our metrics in a dashboard.
We will be installing and running Grafana using the following command:- $ docker run -d --name=grafana -p 3000:3000 grafana/grafana
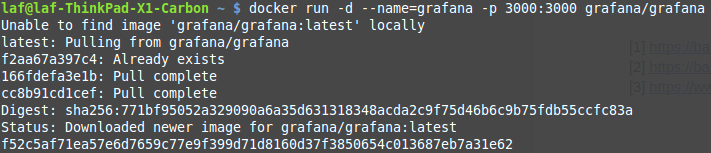
Install and run Grafana
Now, we can go to http://localhost:3000/ to access the Grafana dashboard. From here, you can log in to the system with the default username/password: admin:admin.
Next, we will add a new data source to Grafana, with the following settings:-

Settings for your Prometheus data source
After the data source is saved, the already available Ballerina dashboard can be found at https://grafana.com/dashboards/5841. In order to add it to Grafana, Click [+] -> Import -> 5841 -> Load. After the dashboard is added, you will be able to immediately see the metrics being visualized by the Grafana dashboard.
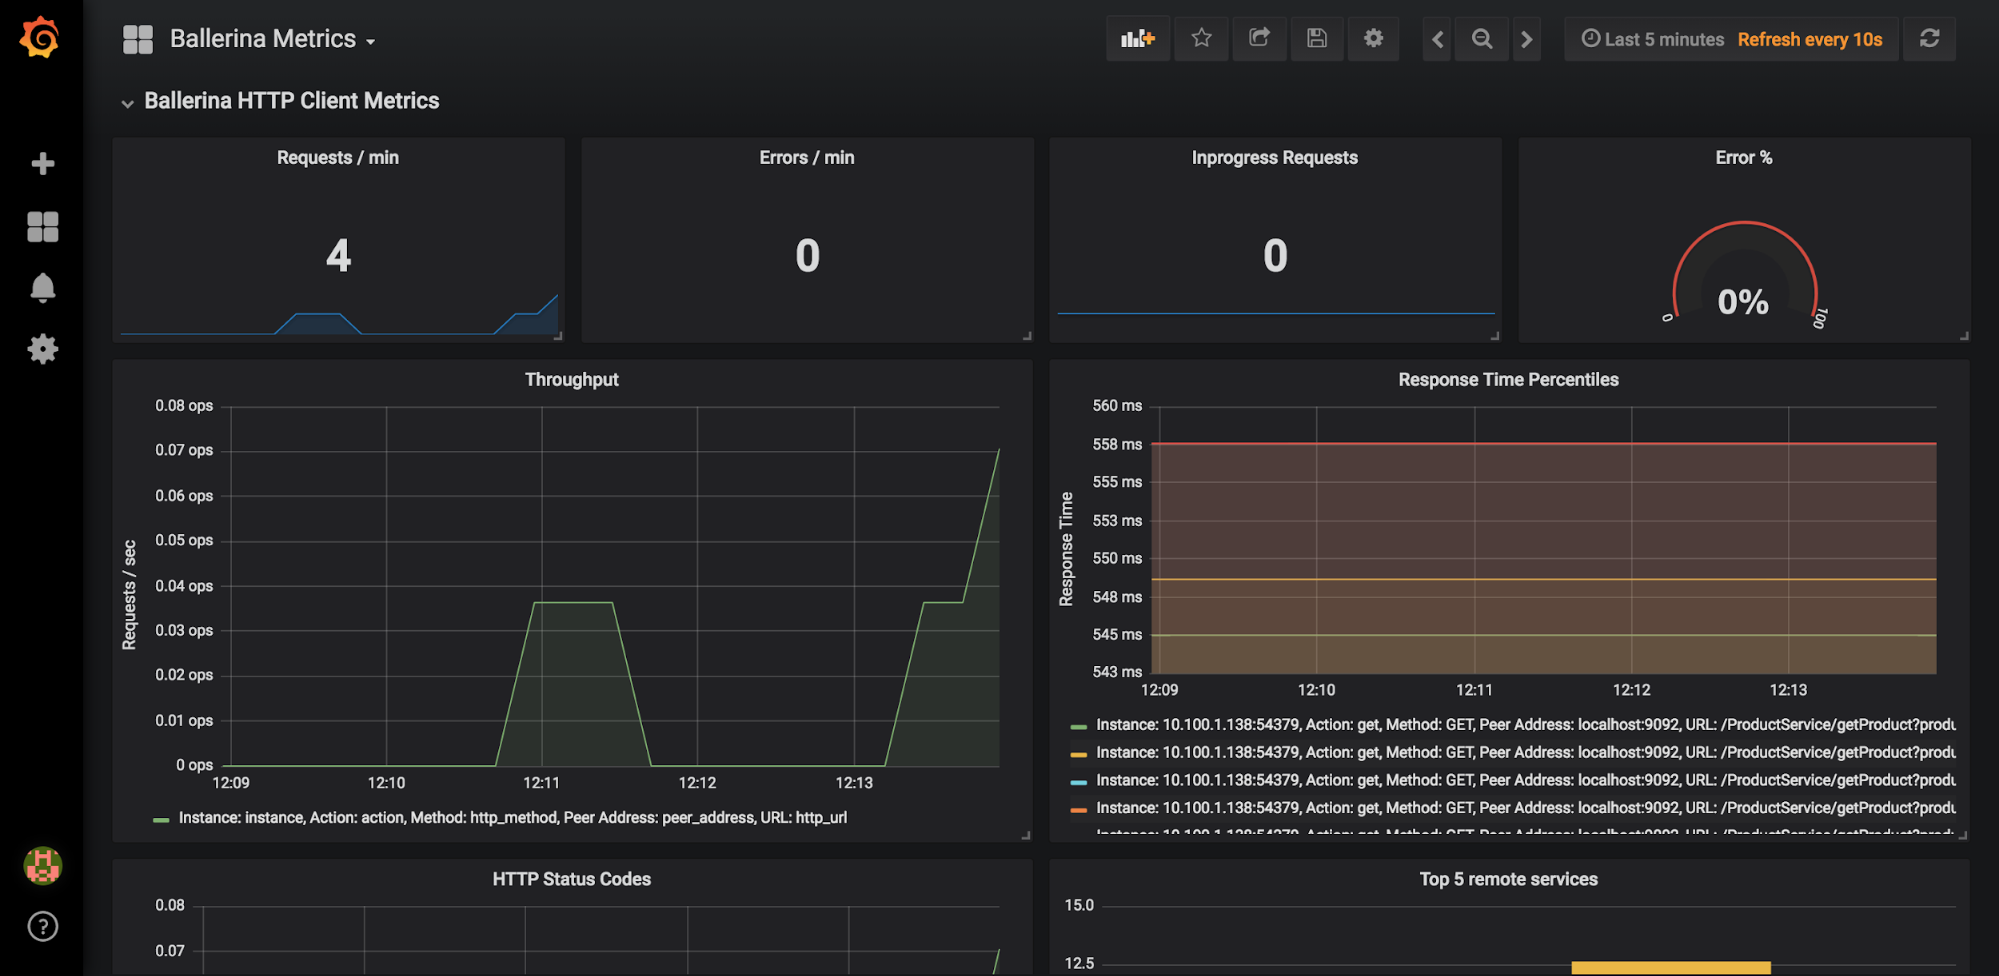
#### Visualizations in the default dashboard
HTTP Service / Client Metrics
- Service and client level statistics such as request/min, errors/min, error%, HTTP error codes distribution etc…
SQL Client Metrics
- RDBMS connector related metrics, such as SQL query execution throughput, response time percentiles, SQL error distribution etc…
Ballerina System Metrics
- Mainly contains the Ballerina scheduler based metrics, such as running worker count, waiting for response worker count etc..
- In order to generate Ballerina scheduler metrics, the Ballerina environment variable “b7a.runtime.scheduler.statistics” should be set to “true”;
$ ballerina run hello.bal --observe -e b7a.runtime.scheduler.statistics=true

The metrics visualization of our hello-world service being invoked

Ballerina scheduler statistics while the hello-world service is invoked repeatedly
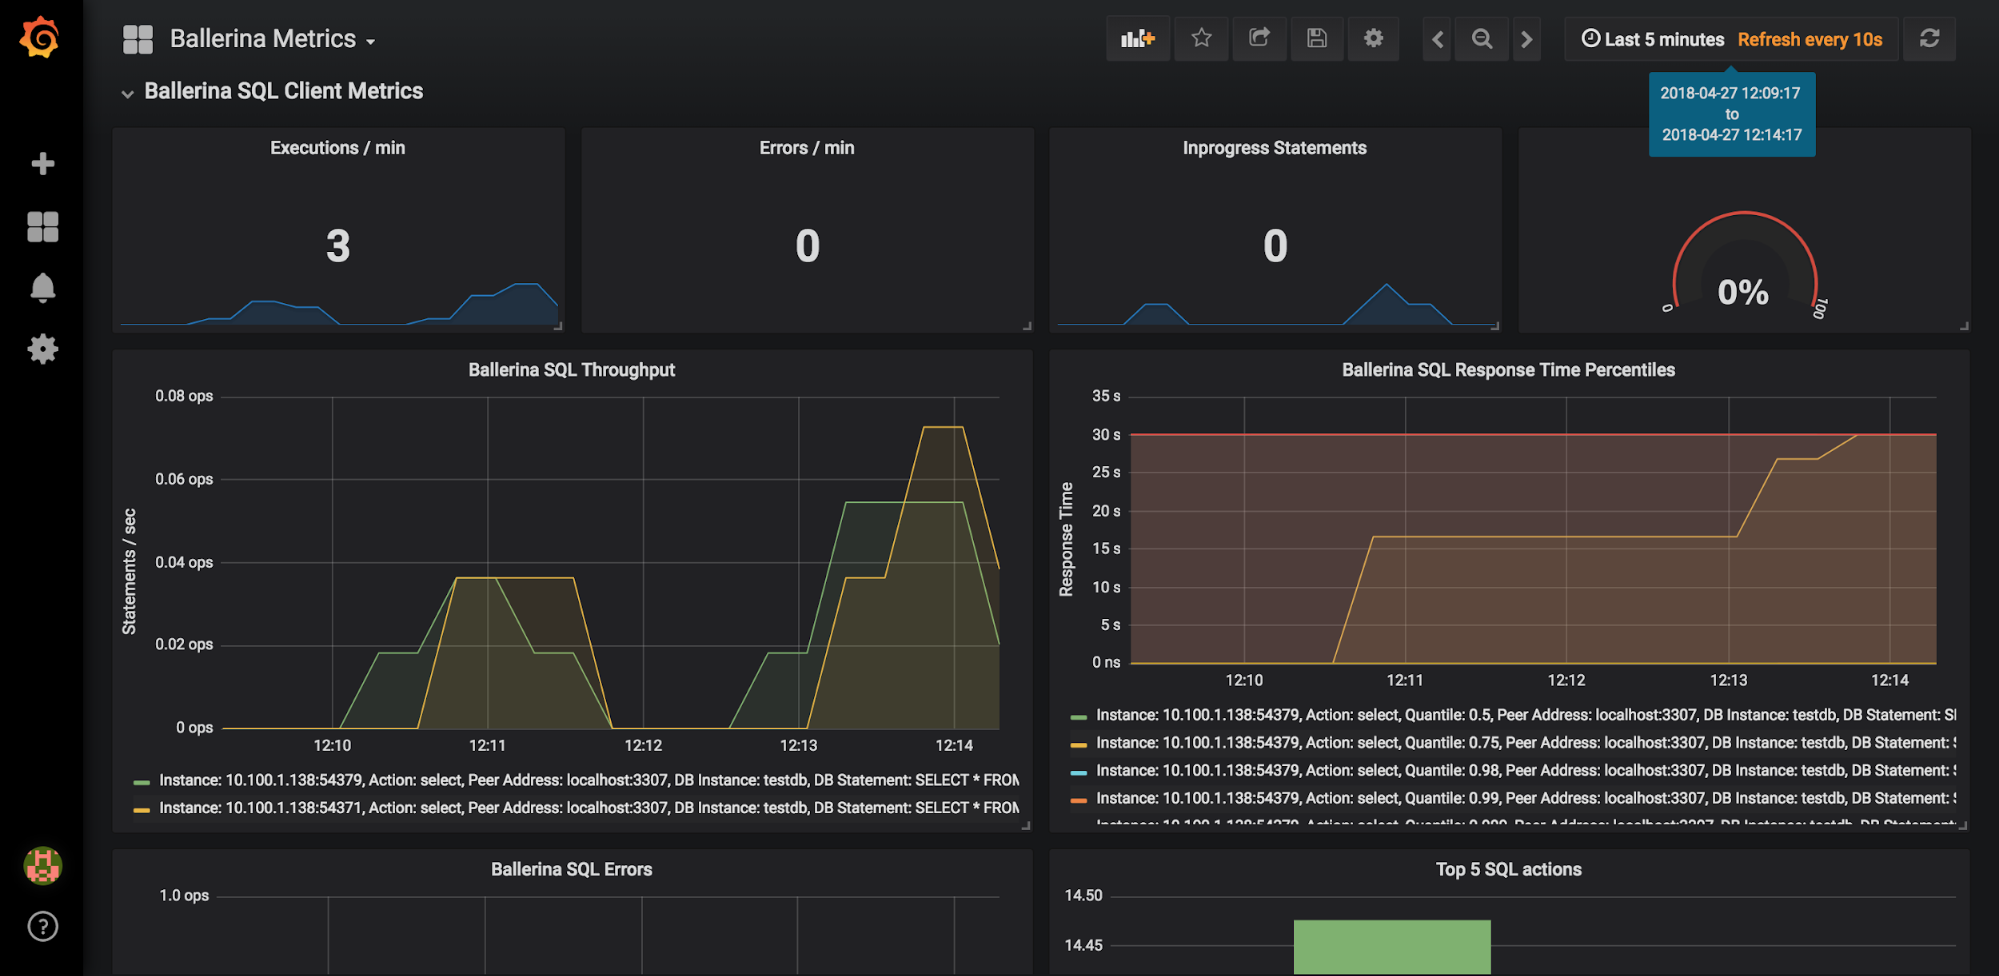
Preview of the Grafana dashboard panels, if we were to have any HTTP client operations and SQL operations to be executed, respectively
So we can see that, using Grafana, we were able to create a beautiful and elegant dashboard for Ballerina metrics without any hassle. It also has the functionality of exposing each data source’s unique querying features, to optimally use the features of the backing TSDB, and rich query templating support in the dashboards. All of these features enabled us to create a functional and robust metrics visualization solution for the Ballerina runtime.
#### [Ballerinacon](https://con.ballerina.io/) **Date: 2018-07-18**
Full day event in San Francisco and also streamed globally. Get intense training on the best practices of microservice development, resiliency, integration, Docker and Kubernetes deployment, Service Meshes, serverless, test-driven microservice development, lifecycle management, observability (including Grafana!), and security.
Grafana community members can attend free: use coupon code BalCon-Grafana when buying the ticket and get your 100% discount.


