

timeShift(GrafanaBuzz, 1w) Issue 36
Welcome to TimeShift
It’s great to be back after a few busy weeks off, and we have lots of updates and articles to share. During GrafanaCon EU 2018 in Amsterdam, we officially launched Grafana 5.0 stable! Despite the “Beast from the East” storm that blew through Europe and stranded two of our speakers, the conference was sold out and we’re extremely proud of the event. We’re taking suggestions for locations for our next GrafanaCon (think: someplace warm).
We’d like to thank all of our speakers, sponsors and attendees for making GrafanaCon such a success. We’ve been overwhelmed by the positive feedback we’ve received and are extremely proud to be part of such an active and passionate open source community. You’ll be able to check out videos of each talk and download the presentation slides on grafana.com shortly, but the live stream is available until they’re ready.
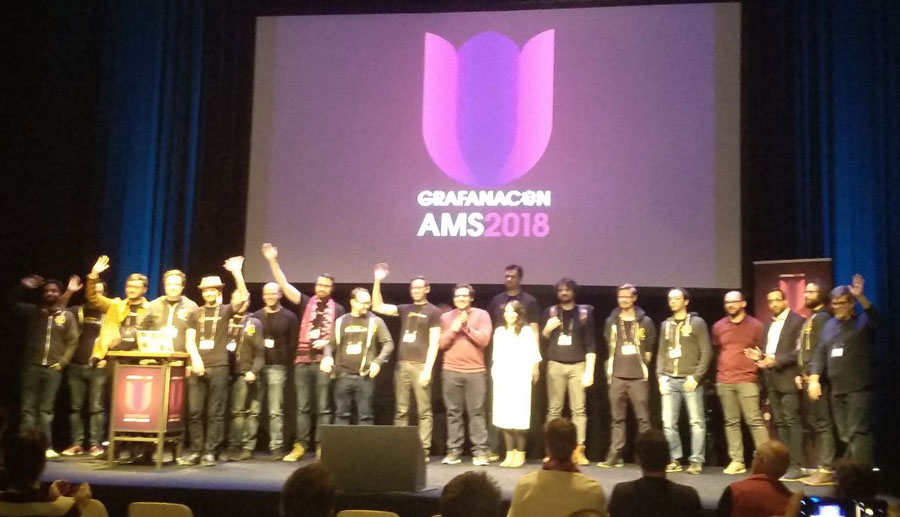
As you can see from the photo below, the Grafana Labs team is growing like crazy (and we’re hiring). We’re excited to welcome Tom and David from Kausal and Goutham as the newest members of the team. We’ll need a bigger stage next time!
Latest Stable Release
Grafana 5.0.3 is now available.
Check out the full release notes to see the features and fixes in Grafana v5.0.3.
Download Grafana 5.0.3 NowFrom the Blogosphere
Kausal to join Grafana Labs to bring Prometheus to the masses: As mentioned above, Grafana Labs has acquired Kausal, who shares a passion for open source software. This article provides a little more detail on the acquisition and our plans for the future.
Instana Releases Grafana Plugin To Enable Seamless Integrations, Customizable Dashboards And Multiple Data Sources: We’re excited to add the Instana data source to our growing list of plugins. This new plugin lets you visualize application, service and website performance metrics from Instana’s AI-Powered APM for dynamic applications.
Monitor the status of your website with worldPing: WorldPing is our very own network performance monitoring product. WorldPing lets you monitor the performance of your web apps from different locations across the globe and is free for up to 1 million checks per month. Jota wrote a getting started guide to show you how easy it is to install and start monitoring your app’s performance.
Provisioning Grafana Data Sources and Dashboards Auto-Magically: One of the new features in Grafana 5 is the ability to provision dashboards and data sources via config files. This article give your a rundown of this new functionality.
Monitoring with Prometheus: Grafana is the recommended visualization tool for Prometheus, a project that has seen staggering adoption. This article goes over the Prometheus basics, the components of the stack and how to use Grafana to visualize your data.
Using Zabbix and Grafana to monitor TFL Underground Rail Lines: Short article about monitoring the status of the London Underground. I can only imagine seeing a dashboard of NYC’s MTA data - Red as far as the eye can see.
Visualizing Room Climate Data with Conectric’s IoT Sensors, Elasticsearch & Grafana: The folks at Conectric put together a walkthrough of how to visualize the data from their sensors in Grafana. They’ve also included a video demo walking you through the process.
Grafana Plugins
While we were busy getting Grafana 5.0 out the door, we didn’t have a lot of time to review new and updated plugins. This week we have a ton to share. It’s easy to install plugins and keep up to date – for on-prem Grafana, use the handy Grafana-cli tool, or update with 1 click if you’re using Hosted Grafana.
Instana Data Source - Instana is an APM for monitoring microservices. It uses the Dynamic Focus queries to show metrics in Grafana.
Moogsoft AIOps App - The Moogsoft AIOps app enables rich reporting and dashboard features you can access from within AIOps.
USGS Water Services Data Source - This new data source from Natel Energy is a great example of how you can use Grafana to visualize all kinds of open data. This data source makes it easy to browse live sensor data from the USGS Water Services. Looking forward to lots more of these types of plugins!
Sumo Logic Data Source - With the new data source for Sumo Logic, you can view metrics and table data from the Search Job API.
Clickhouse Data Source - This data source got an impressive update with two new features:
- Support for adhoc filters
- A new
$unescapemacro. It unescapes a variable value by removing single quotes. Used for multi-value string variables.
Plotly Panel - Updates to this panel include:
- Reasonable behavior when adding single metric
- Support for a single table query
- Converted to TypeScript
D3 Gauge Panel - This panel was updated to make it compatible with Grafana v5.0.
DataTable Panel - This panel was also updated to make it compatible with Grafana v5.0.
Tweet of the Week
We scour Twitter each week to find an interesting/beautiful dashboard and show it off! #monitoringLoveOur "Video Wall on Wheels” is a huge hit at the @klaviyo office and showcases our Grafana dashboards for events like Black Friday. Here’s how @jordantrundy pulled it off https://t.co/tD6zerwzWQ
— Andrew Kenney (@syrneus) March 9, 2018
Very cool - I love the idea of a mobile "wall of Grafana!"
Grafana Labs is Hiring!
We are passionate about open source software and thrive on tackling complex challenges to build the future. We ship code from every corner of the globe and love working with the community. If this sounds exciting, you're in luck – WE'RE HIRING!
Check out our Open Positions
#### How are we doing? Well, that wraps up another issue. What do you think? Are there other types of content you'd like to see here? Submit a comment on this issue below, or post something at our [community forum](https://community.grafana.com?utm_source=blog&utm_campaign=timeshift_36).
Follow us on Twitter, like us on Facebook, and join the Grafana Labs community.
