

Grafana v5.0 Released
We have been working on Grafana v5 for most of 2017 and it’s finally ready! This release is important in a different way than previous releases as main focus has been on improving the core Grafana features and attributes. That means vastly improved UX and page design, easier and more flexible dashboard building enabled by a new grid layout system. Better support for large installations with the addition of Dashboard Folders, Teams and Permissions. Improvements to provisioning/cloud-native setups by making datasources & dashboards configurable from files.
This is the most substantial update that Grafana has ever seen.
What’s New in Grafana v5.0
- New Dashboard Layout Engine enables a much easier drag, drop and resize experience and new types of layouts.
- New UX. The UI has big improvements in both look and function.
- New Light Theme is now looking really nice.
- Dashboard Folders helps you keep your dashboards organized.
- Permissions on folders and dashboards helps manage larger Grafana installations.
- Group users into teams and use them in the new permission system.
- Datasource provisioning makes it possible to setup datasources via config files.
- Dashboard provisioning makes it possible to setup dashboards via config files.
- Graphite Tags & Integrated Function Docs.
Video showing new features
New Dashboard Layout Engine
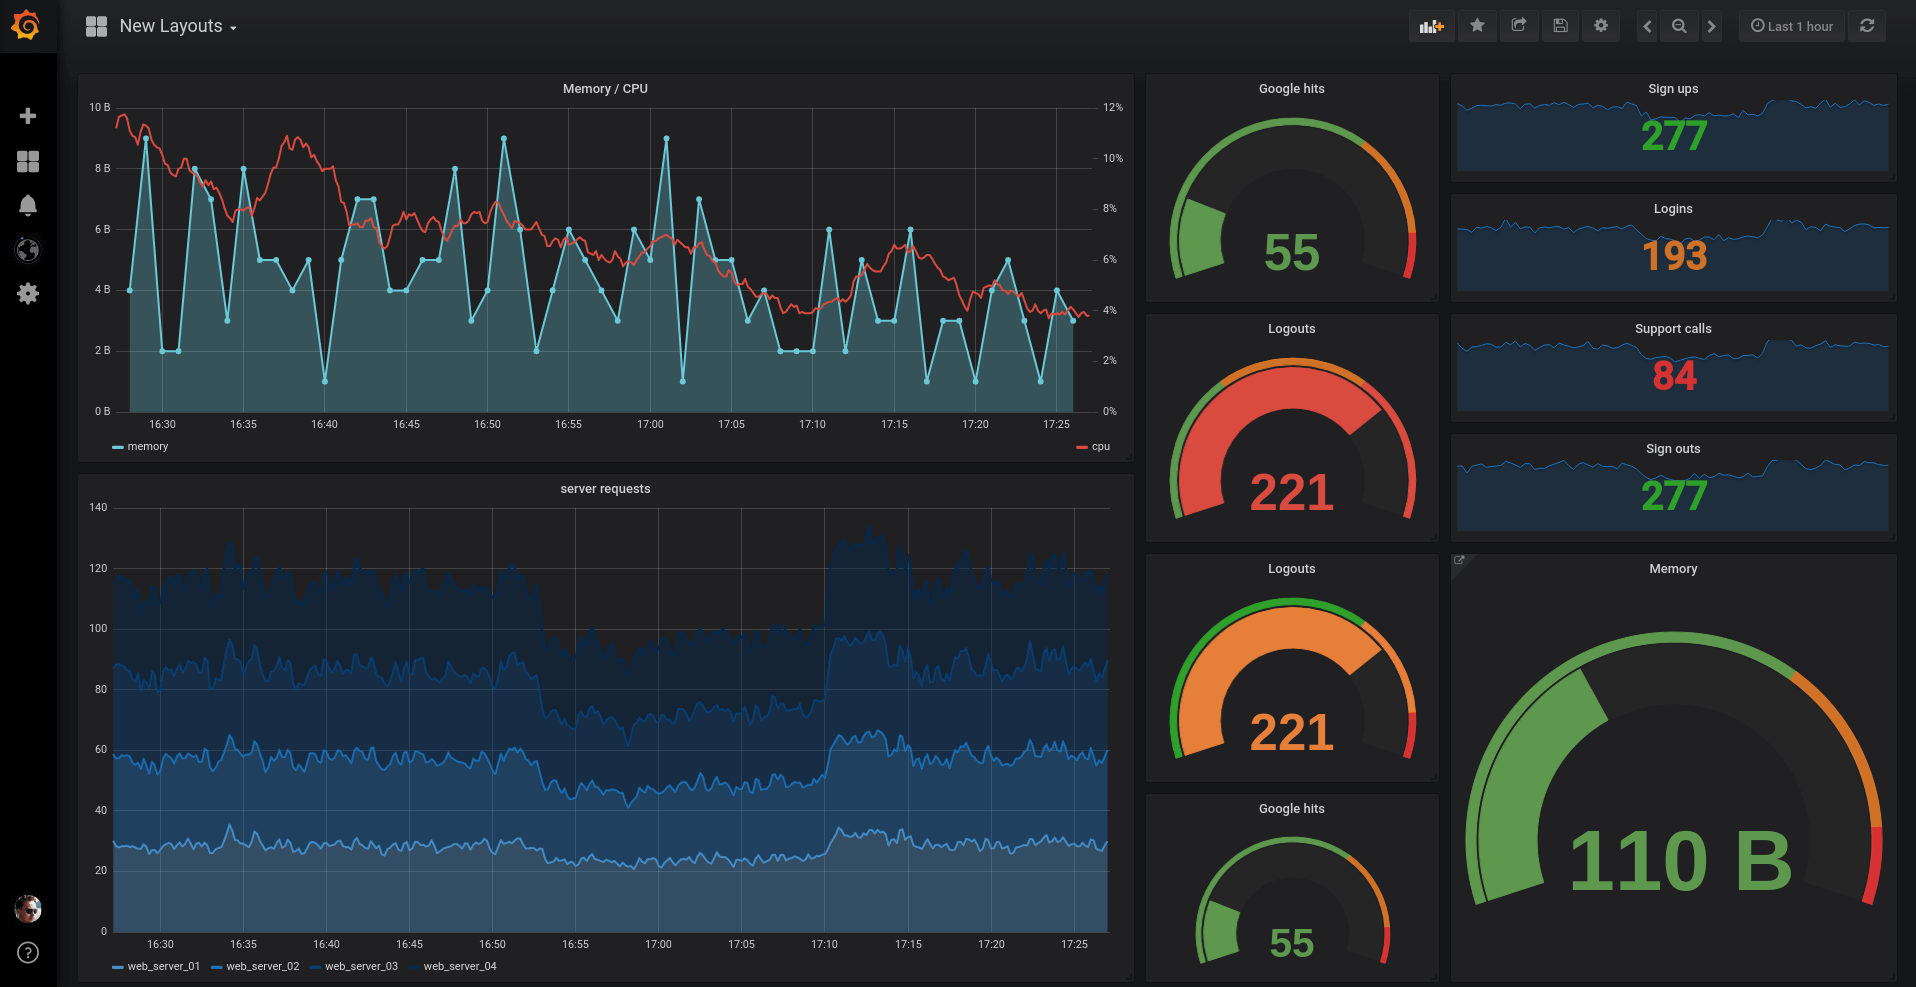
The new dashboard layout engine allows for much easier movement and sizing of panels, as other panels now move out of the way in a very intuitive way. Panels are sized independently, so rows are no longer necessary to create layouts. This opens up many new types of layouts where panels of different heights can be aligned easily. Checkout the new grid in the video above or on the play site. All your existing dashboards will automatically migrate to the new position system and look close to identical. The new panel position makes dashboards saved in v5.0 incompatible with older versions of Grafana.
New UX
Almost every page has seen significant UX improvements. All pages (except dashboard pages) have a new tab-based layout that improves navigation between pages. The side menu has also changed quite a bit. You can still hide the side menu completely if you click on the Grafana logo.
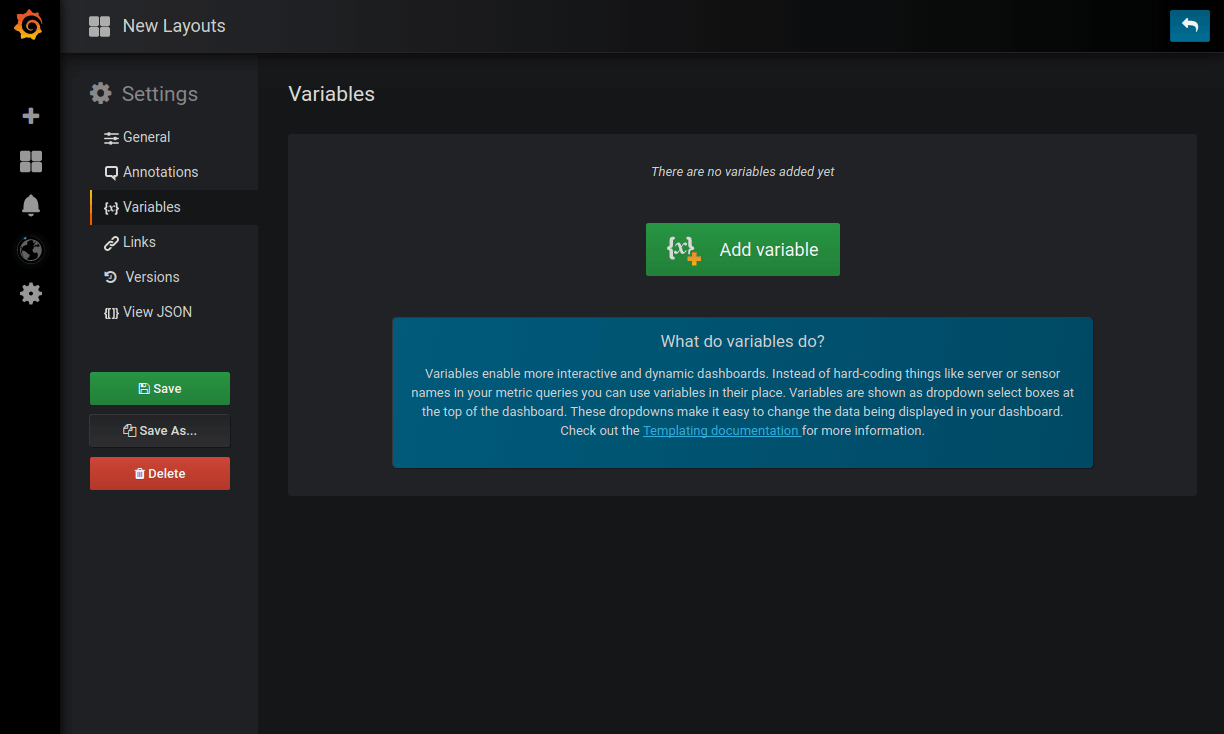
Dashboard Settings
New Light Theme
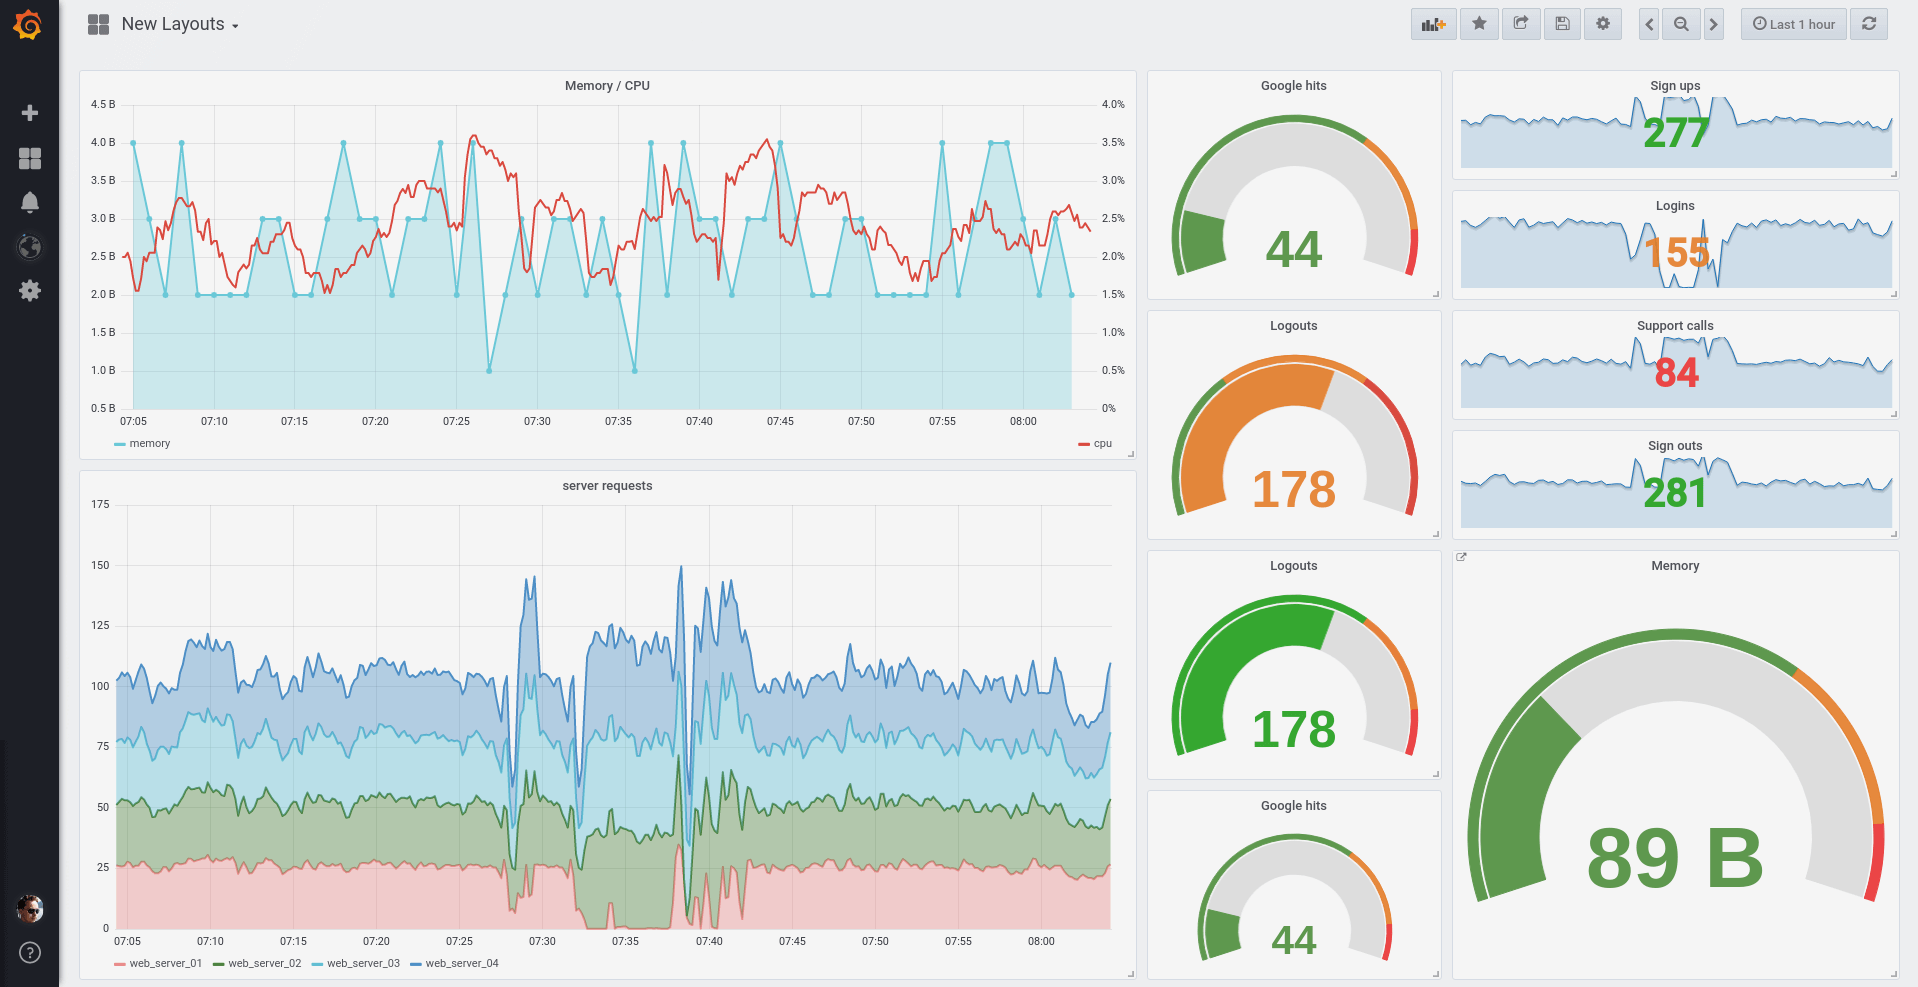
This theme has not seen a lot of love in recent years and we felt it was time to give it a major overhaul. We are very happy with the result.
Dashboard Folders
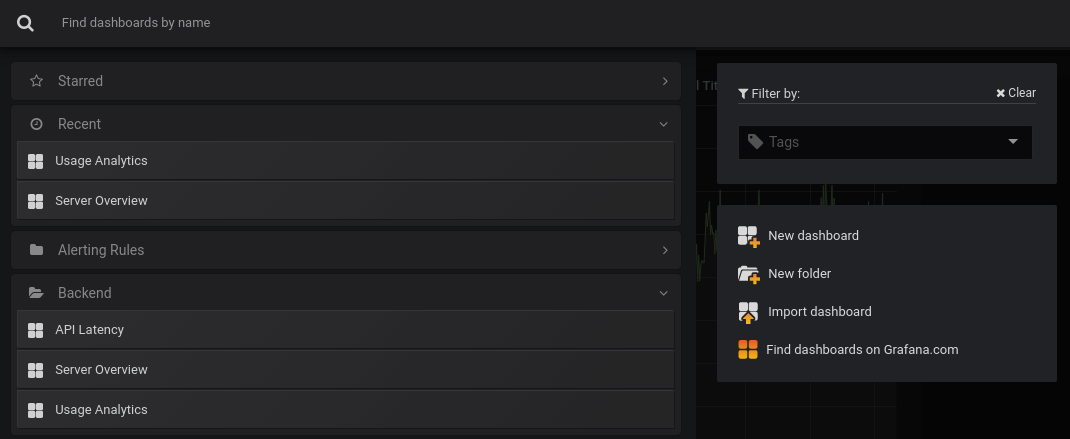
The big new feature that comes with Grafana v5.0 is dashboard folders. Now you can organize your dashboards in folders, which is very useful if you have a lot of dashboards or multiple teams.
- New search design adds expandable sections for each folder, starred and recently viewed dashboards.
- New manage dashboard pages enable batch actions and views for folder settings and permissions.
- Set permissions on folders and have dashboards inherit the permissions.
Teams
A team is a new concept in Grafana v5. They are simply a group of users that can be used in the new permission system for dashboards and folders. Only an admin can create teams. We hope to do more with teams in future releases like integration with LDAP and a team landing page.
Permissions
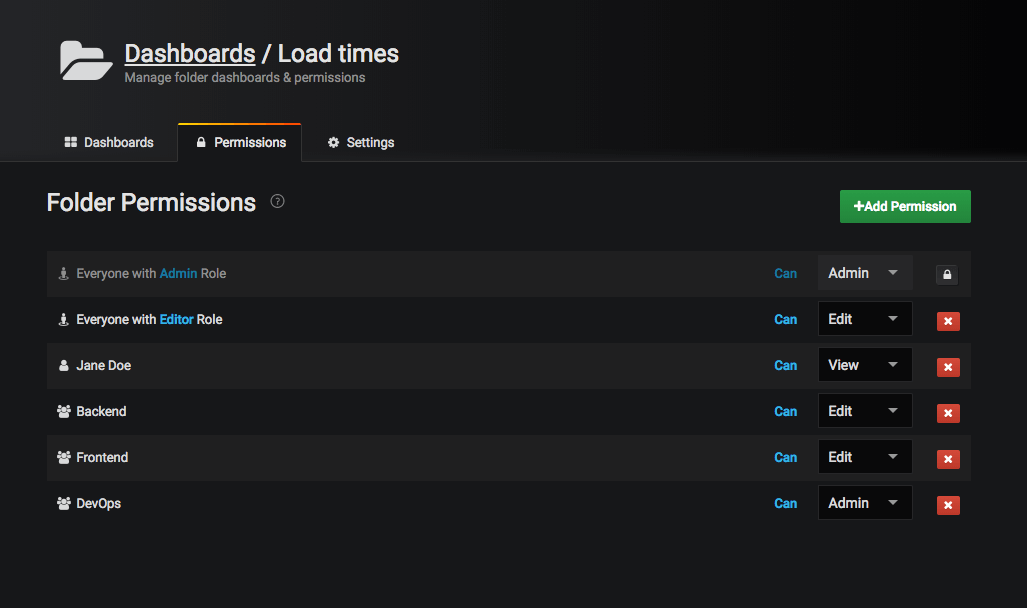
You can assign permissions to folders and dashboards. The default user role-based permissions can be removed and replaced with specific teams or users enabling more control over what a user can see and edit.
Dashboard permissions only limits what dashboards & folders a user can view & edit not which data sources a user can access nor what queries a user can issue.
Provisioning from configuration
In previous versions of Grafana, you could only use the API for provisioning data sources and dashboards. But that required the service to be running before you started creating dashboards and you also needed to set up credentials for the HTTP API. In v5.0 we decided to improve this experience by adding a new active provisioning system that uses config files. This will make GitOps more natural as data sources and dashboards can be defined via files that can be version controlled. We hope to extend this system to later add support for users, orgs and alerts as well.
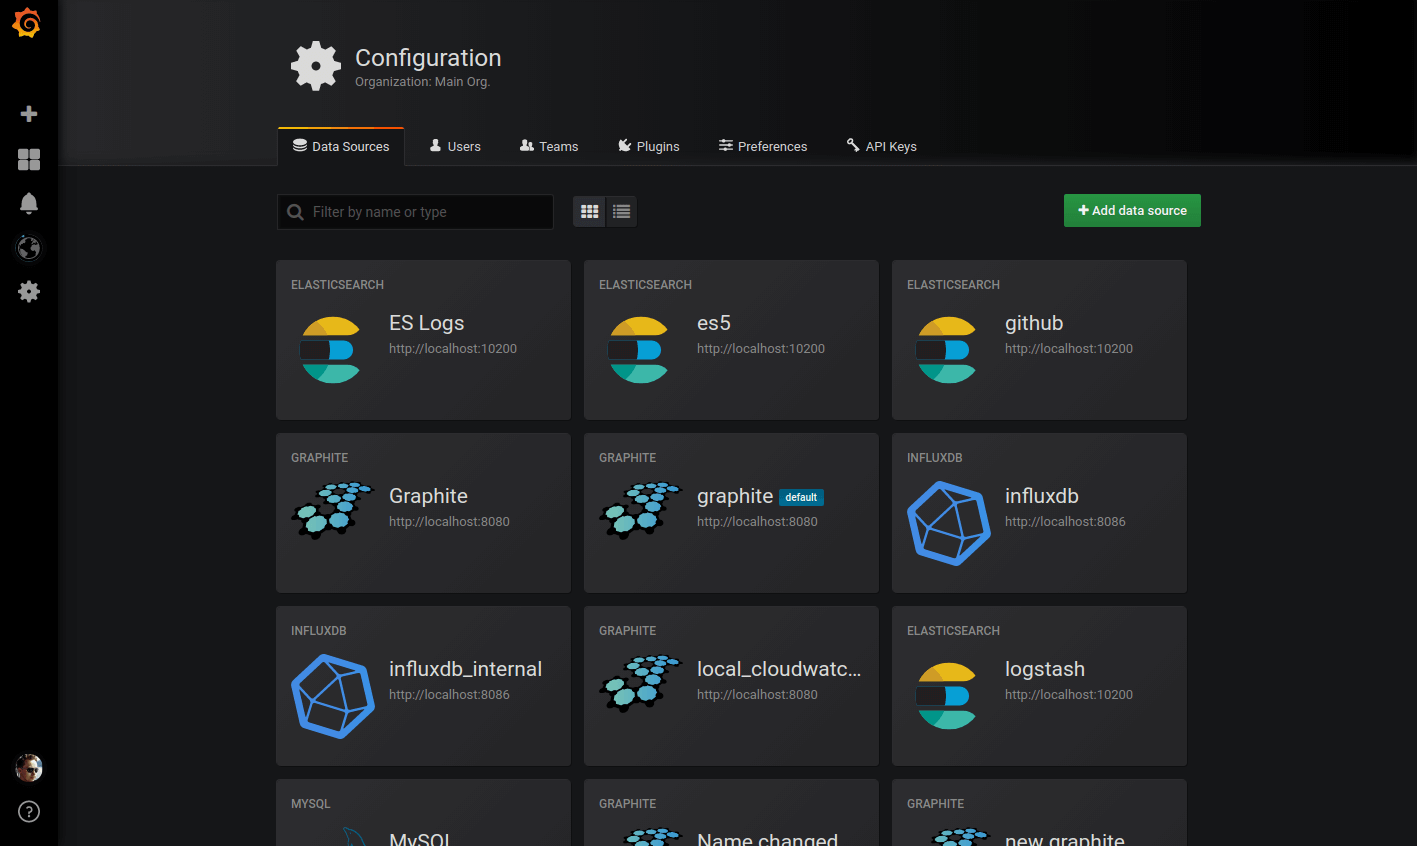
Data sources
Data sources can now be setup using config files. These data sources are by default not editable from the Grafana GUI. It’s also possible to update and delete data sources from the config file. More info in the data source provisioning docs.
Dashboards
We also deprecated the [dashboard.json] in favor of our new dashboard provisioner that keeps dashboards on disk
in sync with dashboards in Grafana’s database. The dashboard provisioner has multiple advantages over the old
[dashboard.json] feature. Instead of storing the dashboard in memory we now insert the dashboard into the database,
which makes it possible to star them, use one as the home dashboard, set permissions and other features in Grafana that
expects the dashboards to exist in the database. More info in the dashboard provisioning docs
Graphite Tags & Integrated Function Docs
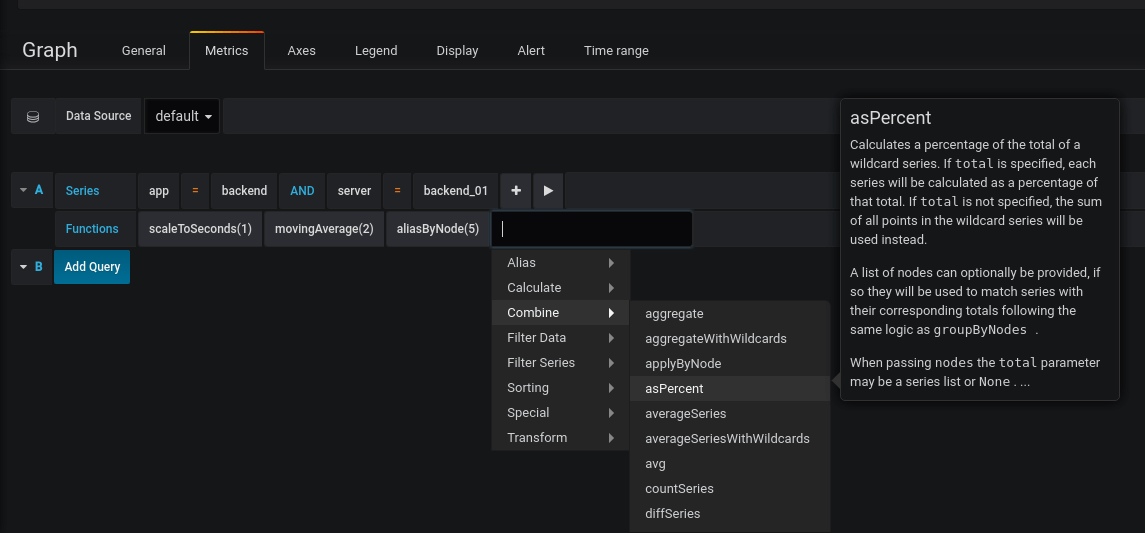
The Graphite query editor has been updated to support the latest Graphite version (v1.1) that adds many new functions and support for querying by tags. You can now also view function documentation right in the query editor!
Read more on Graphite Tag Support.
Changelog
Checkout the CHANGELOG.md file for a complete list of new features, changes, and bug fixes.
Download
Head to download page for download links & instructions.
Thanks
A big thanks to all the Grafana users who contribute by submitting PRs, bug reports & feedback!


