

timeShift(GrafanaBuzz, 1w) Issue 33
Welcome to TimeShift
If you use the light theme, please give 5.0 beta a try and let us know what you think over at our community site. Check out the video to see some of v5's new features.
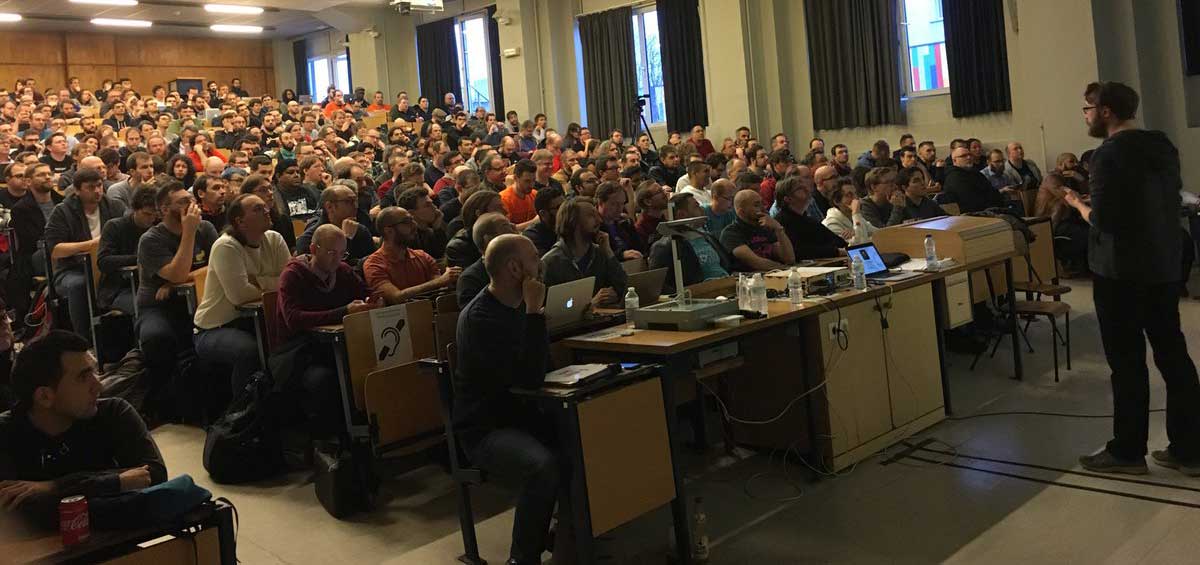
Torkel speaking in the Monitoring and Cloud dev room at FOSDEM
Latest Beta Release
Grafana 5.0 beta is available.
Check out the full release notes to see the features and fixes.
Download Grafana v5 Beta NowFrom the Blogosphere
FOSDEM Dashboards: The organizers at FOSDEM used Grafana to track a number of metrics for the conference. They’ve made the dashboard public so have fun exploring the data. One of the very clever ways they used Grafana was to track t-shirt inventory. Definitely gives us some ideas for GrafanaCon. ;)
Swetugg: Swetugg is a .NET conference held in Stockholm. This year, our own Daniel Lee took the stage to talk about monitoring and why it’s important, an intro to Grafana, the Azure Monitor Data Source Plugin, and how to build a custom integration in .NET Core for Grafana. Check out his slides and reach out if you have any questions.
Simple ChatOps with Kafka, Grafana, Prometheus, and Slack: This tutorial describes an approach for building a simple ChatOps bot, which uses Slack and Grafana to query system status. The idea is to be able to check the status of your system with a conversational interface if you’re away from your desk, but you still have basic connectivity e.g. on your phone.
Aerogear Metrics Demo: Dara from the Aerogear team at Red Hat Mobile put together a video discussing the Aerogear Metrics Service and its two parts: Prometheus and Grafana, then demos the functionality.
Network Infrastructure Weathermap: This article provides a walkthrough on creating a “Network Infrastructure Weather Map” to get a high level overview of your network backbone using only open source tools.
Integrating Elasticsearch and Logstash with NetApp Harvest and Grafana : Part 4: This is part 4 in the series where James walks us through how to set up the Elasticsearch data source in Grafana. His instructions include steps for both v4.X and the new v5 beta.
Automatic Graphing of Google Document Data: Sometimes our data isn’t in the most friendly format, or perhaps in some non devops usecases, we’ve just written it down somewhere. This article takes a stab at getting data from Google Sheets and visualizing it in Grafana.

GrafanaCon and the Launch of Grafana v5.0
Tickets are going fast, but there are still a handful left. Join us in Amsterdam for the launch of Grafana v5.0 and two days of talks about Grafana and the open source monitoring ecosystem. We have talks lined up from Google, Bloomberg, CERN, Tinder, eBay and more! Each ticket gets you:
- 30+ speakers on Graphite, Prometheus, InfluxDB, Kubernetes, IoT and more
- Breakfast, lunch and snacks both days
- After conference party with dinner and drinks
- Admission to the Grafana 5 launch party following the after conference party
- Friends for life!
Upcoming Events
In between code pushes we like to speak at, sponsor and attend all kinds of conferences and meetups. We also like to make sure we mention other Grafana-related events happening all over the world. If you’re putting on just such an event, let us know and we’ll list it here.

InfluxDays NYC | New York, NY - Feb 13, 2018:
Jacob Lisi - What Does Kubernetes Look Like?: Performance Monitoring & Visualization with Grafana
Monitoring Kubernetes is vital to understanding the health and performance of a cluster, but which metrics are most important to add to your dashboards and alert on? Jacob will discuss how to most effectively monitor and visualize your Kubernetes cluster using the Grafana Kubernetes plugin and PromQL.

OpenNMS - Introduction to "Grafana" | Webinar - Feb 21, 2018:
IT monitoring helps detect emerging hardware damage and performance bottlenecks in the enterprise network before any consequential damage or disruption to business processes occurs. The powerful open-source OpenNMS software monitors a network, including all connected devices, and provides logging of a variety of data that can be used for analysis and planning purposes. In our next OpenNMS webinar on February 21, 2018, we introduce "Grafana" - a web-based tool for creating and displaying dashboards from various data sources, which can be perfectly combined with OpenNMS.
NYC Metrics and Monitoring | New York, NY - Feb 22, 2018:
The Modern, Open Source Metrics Stack, told in 4 Acts
The metrics landscape is constantly evolving. Teams are always evaluating new technologies, scaling established technologies, and finding the best ways for them to work together cohesively.
Our night will be 4 (maybe 5) lightning talks focusing on these challenges, what technologies they've used, are using, and are interested in. The talks will move quickly and leave plenty of time for discussion after.
Register NowTweet of the Week
We scour Twitter each week to find an interesting/beautiful dashboard and show it off! #monitoringLoveAnt Farm #devops #timeseriesdata #grafana pic.twitter.com/Q3MW8BWm01
— Time Series Art (@TimeSeriesArt) February 9, 2018
		<p><a href="https://twitter.com/TimeSeriesArt" target="-blank">@TimeSeriesArt</a> has been taking Grafana graphs and adding some new elements to tell a story. Fun twitter feed to check out. Keep it up!</p>
	</div>
</div>
Grafana Labs is Hiring!
We are passionate about open source software and thrive on tackling complex challenges to build the future. We ship code from every corner of the globe and love working with the community. If this sounds exciting, you're in luck – WE'RE HIRING!
Check out our Open Positions
#### How are we doing? Hope you enjoyed this issue of TimeShift. What do you think? Are there other types of content you'd like to see here? Submit a comment on this issue below, or post something at our [community forum](https://community.grafana.com?utm_source=blog&utm_campaign=timeshift_33).
Follow us on Twitter, like us on Facebook, and join the Grafana Labs community.