timeShift(GrafanaBuzz, 1w) Issue 32
Welcome to TimeShift
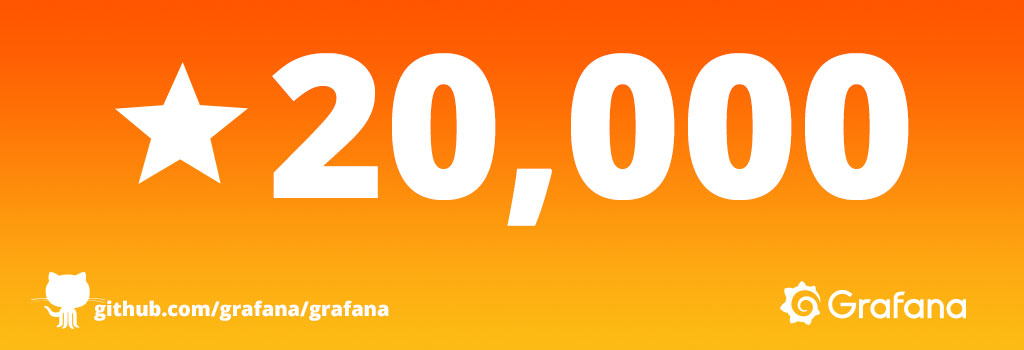 This week Grafana crossed [20,000 stars on Github](http://github.com/grafana/grafana)! Big thanks to the Grafana community!
We’re feverishly working on the upcoming Grafana 5.0 release scheduled to go out next week, and we’d like your feedback.
Also - We have a busy week coming up with conferences and meetups we’re speaking at, starting with FOSDEM in Brussels, Feb 3-4 where Grafana creator Torkel Odegaard will be showing off what’s new in Grafana v5. After FOSDEM, Carl Bergquist and Leonard Gram will be discussing monitoring and devops at Jfokus in Stockholm Feb 5-7. Rounding out the week, Stockholm Metrics and Monitoring will have Adrian Cole talking about logging, metrics, and distributed tracing on Feb 7. The meetup is currently at capacity, but you can get still get on the waiting list.
#### Latest Stable Release
Grafana 4.6.3 is available.
Check out the full release notes too see the features and fixes.
Download Grafana 4.6.3 NowFrom the Blogosphere
Dashboards as Code: Jonathan Lange from Weaveworks walks you through the steps to get your dashboards and configs into version control so you can treat them like any other code or configuration. He will also be giving a presentation on dashboards as code at our upcoming GrafanaCon EU.
Prometheus Alerts on OpenShift: Prometheus is now a native product in the OpenShift stack. This guide will help you configure OpenShift Prometheus to send email alerts and walk you through the Grafana setup to visualize metrics about your cluster.
Monitoring large scale e-commerce websites at MakeMyTrip: It’s always interesting to see how monitoring has been implemented in companies of all sizes and learn why they made certain decisions. This ongoing series of articles focuses on online travel company MakeMyTrip and dives into every aspect of their monitoring stack.
Monitor OpenSMTPD using Logstash and Grafana: Learn how to gain insight into your OpenSMTPD traffic using Logstash/Elasticsearch/Grafana. As the opening line says - Logs are useful. Graphs are sexy.
Visualising IOT Data on a Pi Cluster using Mesos, Spark & Kafka: We’re seeing more and more IoT enthusiasts using Grafana to visualize realtime sensor data. Follow along with Andy as he details his journey of implementing Spark, Mesos, Kafka and Scala to capture metrics from his sensor and display them in Grafana.

GrafanaCon and the Launch of Grafana v5.0
Join us in Amsterdam as we announce the launch of Grafana v5.0 and participate in two days of talks about Grafana and the open source monitoring ecosystem. See talks from Google, Bloomberg, CERN, Tinder, eBay and more! Each ticket get you:
- 30+ speakers on Graphite, Prometheus, InfluxDB, Kubernetes, IoT and more
- Breakfast, lunch and snacks both days
- After conference party with dinner and drinks
- Admission to the Grafana 5 launch party following the after conference party
- Friends for life!
Upcoming Events
In between code pushes we like to speak at, sponsor and attend all kinds of conferences and meetups. We also like to make sure we mention other Grafana-related events happening all over the world. If you’re putting on just such an event, let us know and we’ll list it here.

Torkel Odegaard - Grafana Tips & Tricks & Whats New in v5
FOSDEM is a free event and all are welcome to attend. No need to register.
All are welcome!

Jfokus | Stockholm, Sweden - Feb 5-7, 2018:
Carl Bergquist - Quickie: Monitoring? Not OPS Problem
Why should we monitor our system? Why can't we just rely on the operations team anymore? They use to be able to do that. What's currently changing? Presentation content: - Why do we monitor our system - How did it use to work? - Whats changing - Why do we need to shift focus - Everyone should be on call. - Resilience is the goal (Best way of having someone care about quality is to make them responsible).
Jfokus | Stockholm, Sweden - Feb 5-7, 2018:
Leonard Gram - Presentation: DevOps Deconstructed
What's a Site Reliability Engineer and how's that role different from the DevOps engineer my boss wants to hire? I really don't want to be on call, should I? Is Docker the right place for my code or am I better of just going straight to Serverless? And why should I care about any of it? I'll try to answer some of these questions while looking at what DevOps really is about and how commodisation of servers through "the cloud" ties into it all. This session will be an opinionated piece from a developer who's been on-call for the past 6 years and would like to convince you to do the same, at least once.
Stockholm Metrics and Monitoring | Stockholm, Sweden - Feb 7, 2018:
Observability 3 ways - Logging, Metrics and Distributed Tracing by Adrian Cole
Let’s talk about often confused telemetry tools: Logging, Metrics and Distributed Tracing. We’ll show how you capture latency using each of the tools and how they work differently. Through examples and discussion, we’ll note edge cases where certain tools have advantages over others. By the end of this talk, we’ll better understand how each of Logging, Metrics and Distributed Tracing aids us in different ways to understand our applications.

InfluxDays NYC | New York, NY - Feb 13, 2018:
Jacob Lisi - What Does Kubernetes Look Like?: Performance Monitoring & Visualization with Grafana
Monitoring Kubernetes is vital to understanding the health and performance of a cluster, but which metrics are most important to add to your dashboards and alert on? Jacob will discuss how to most effectively monitor and visualize your Kubernetes cluster using the Grafana Kubernetes plugin and PromQL.

OpenNMS - Introduction to "Grafana" | Webinar - Feb 21, 2018:
IT monitoring helps detect emerging hardware damage and performance bottlenecks in the enterprise network before any consequential damage or disruption to business processes occurs. The powerful open-source OpenNMS software monitors a network, including all connected devices, and provides logging of a variety of data that can be used for analysis and planning purposes. In our next OpenNMS webinar on February 21, 2018, we introduce "Grafana" - a web-based tool for creating and displaying dashboards from various data sources, which can be perfectly combined with OpenNMS.
Tweet of the Week
We scour Twitter each week to find an interesting/beautiful dashboard and show it off! #monitoringLoveThat was then, this is now... Have discovered the combination of collectd, influxdb and Grafana and am now moving my monitoring of various RPi systems over from MRTG to Grafana. Looks slick, easy to tweak and now monitoring the garage/workshop temperature 24/7! pic.twitter.com/HKs2x1UmIm
— Andy G7UHN (@G7UHN) February 1, 2018
Night and day! Welcome to the Grafana community. Watch out - building dashboards can become addictive!
Grafana Labs is Hiring!
We are passionate about open source software and thrive on tackling complex challenges to build the future. We ship code from every corner of the globe and love working with the community. If this sounds exciting, you're in luck – WE'RE HIRING!
Check out our Open Positions
#### How are we doing? What do you think? Are there other types of content you'd like to see here? Submit a comment on this issue below, or post something at our [community forum](https://community.grafana.com?utm_source=blog&utm_campaign=timeshift_31).
Follow us on Twitter, like us on Facebook, and join the Grafana Labs community.
