Torkel Ödegaard
CGO, Co-founder, Grafana Labs
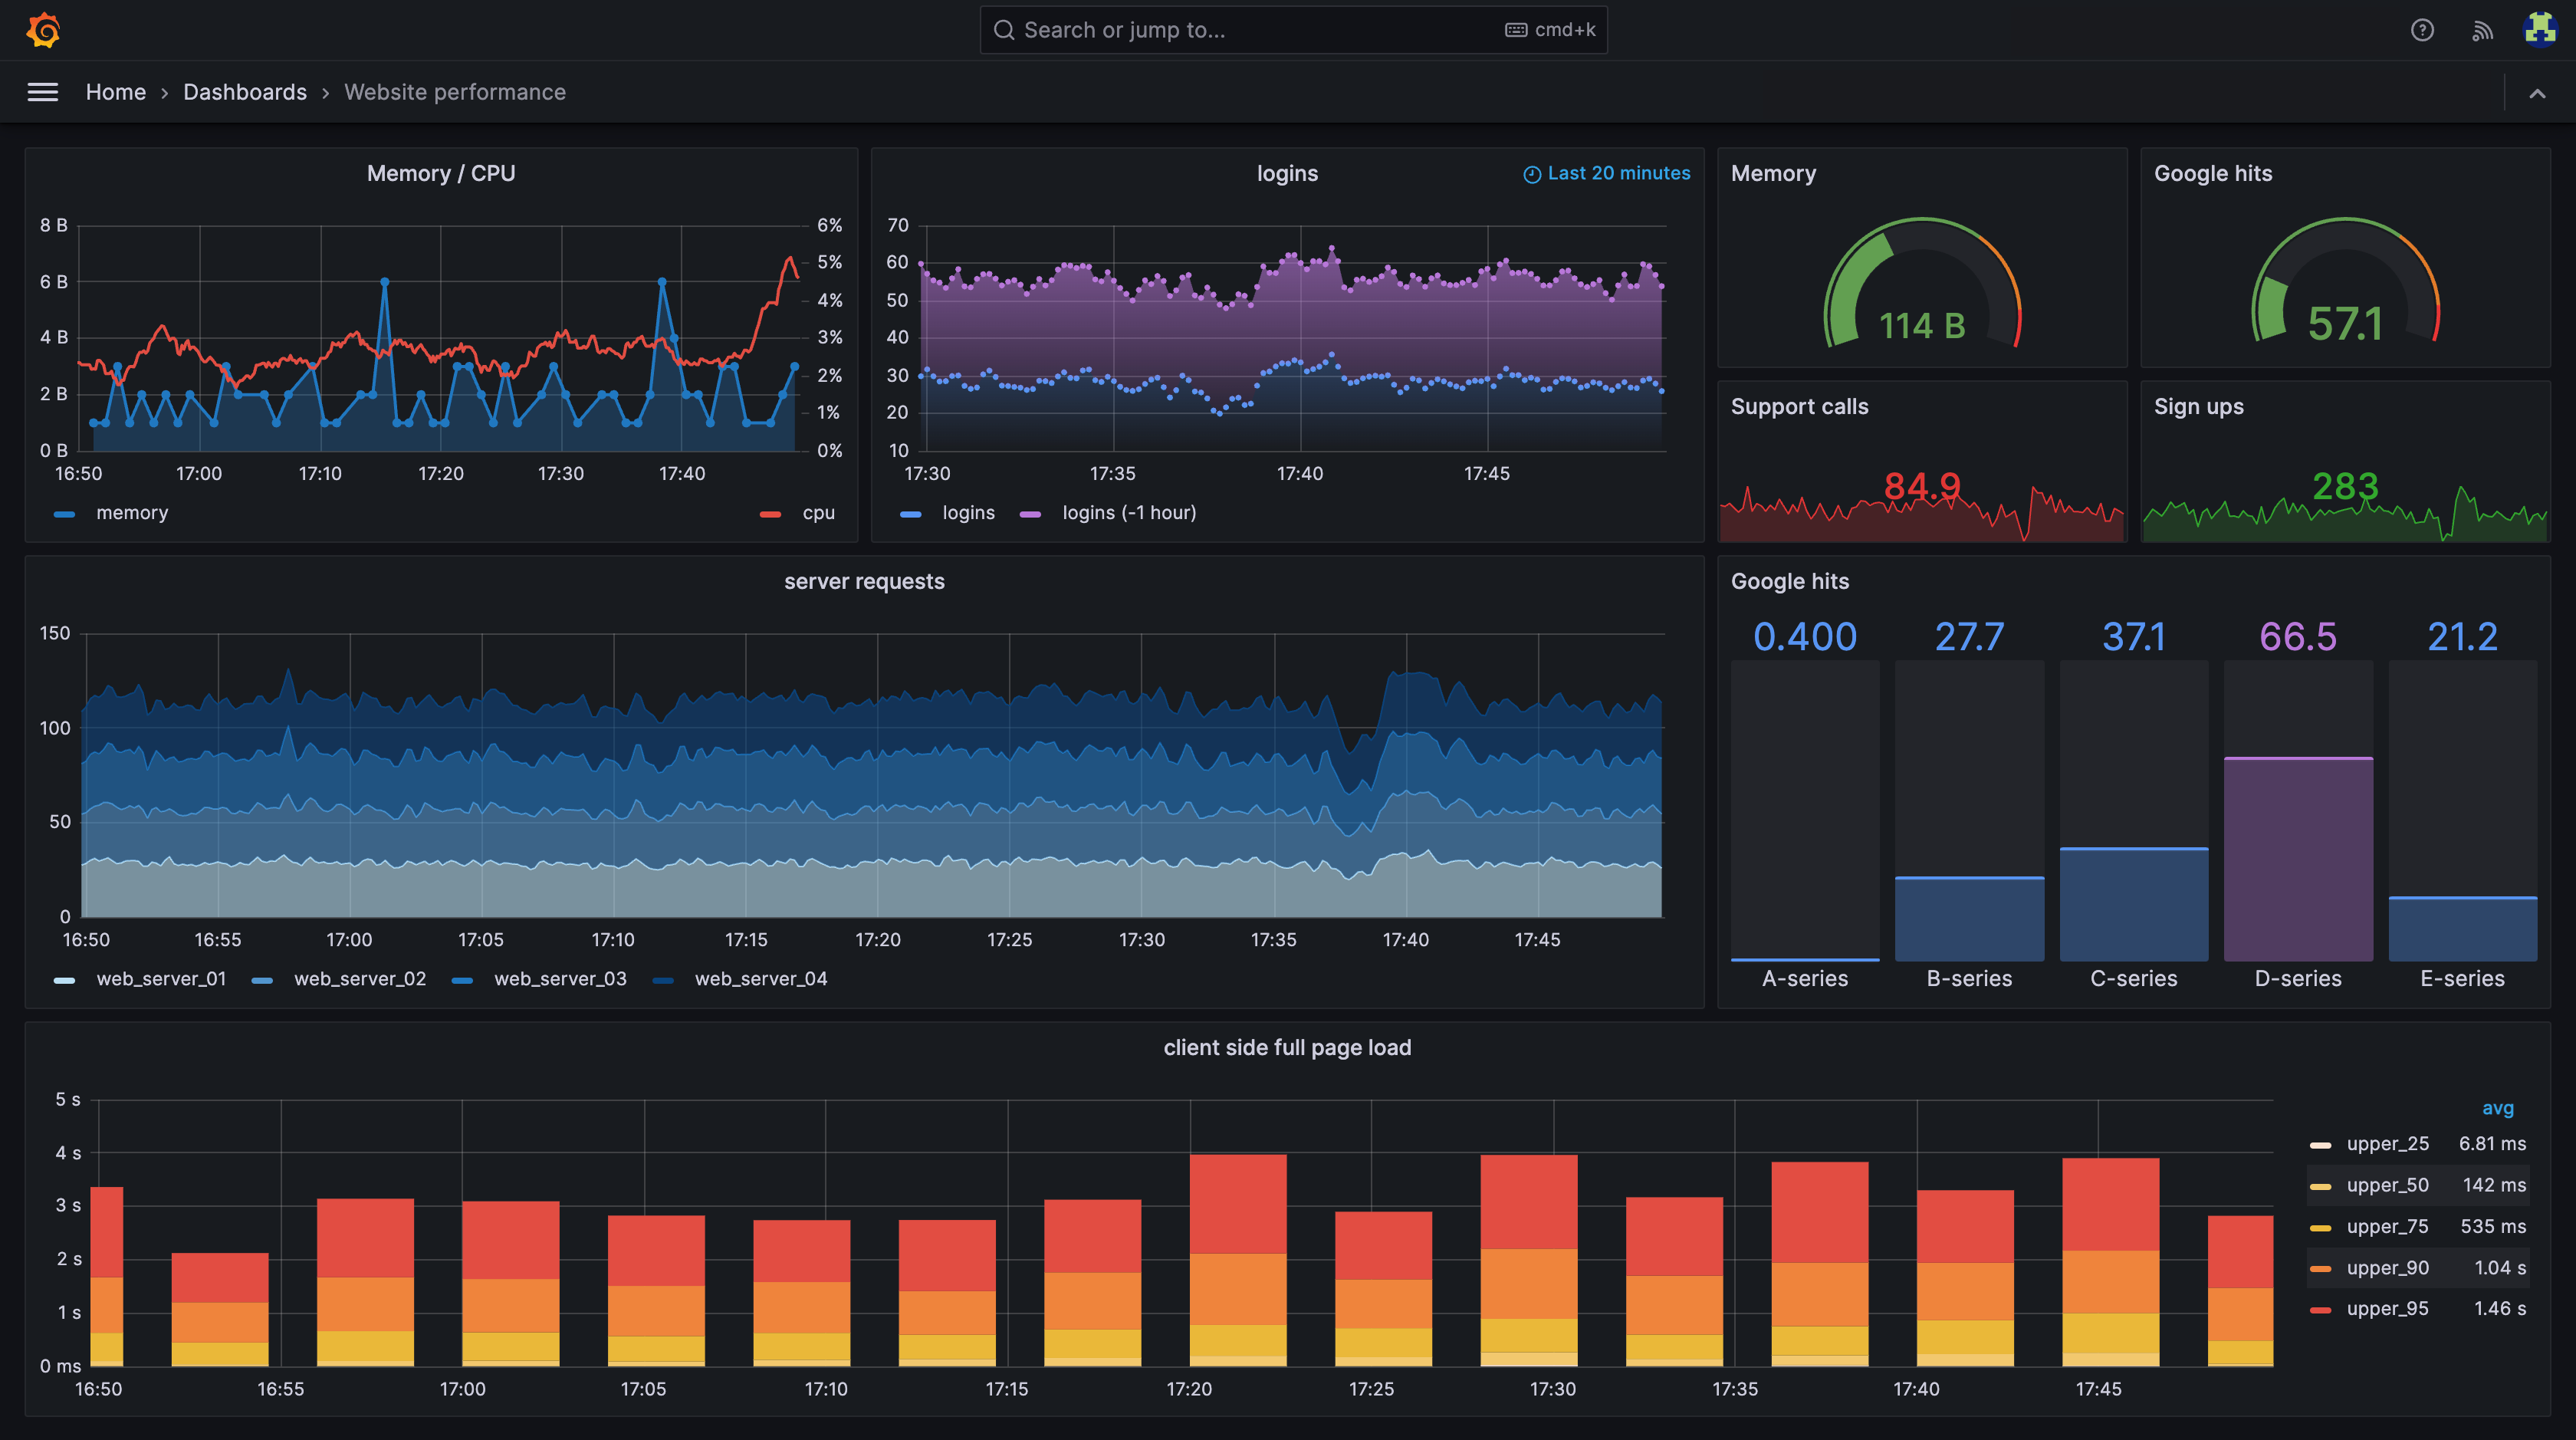
Easily collect, correlate, and visualize data with beautiful dashboards using Grafana — the open source data visualization and monitoring solution that drives informed decisions, enhances system performance, and streamlines troubleshooting.
The easiest way to get started with the latest version of Grafana is with Grafana Cloud, our fully managed observability stack.
With 150+ Grafana plugins, you can unify all your data sources into a single dashboard to streamline data monitoring and troubleshooting.
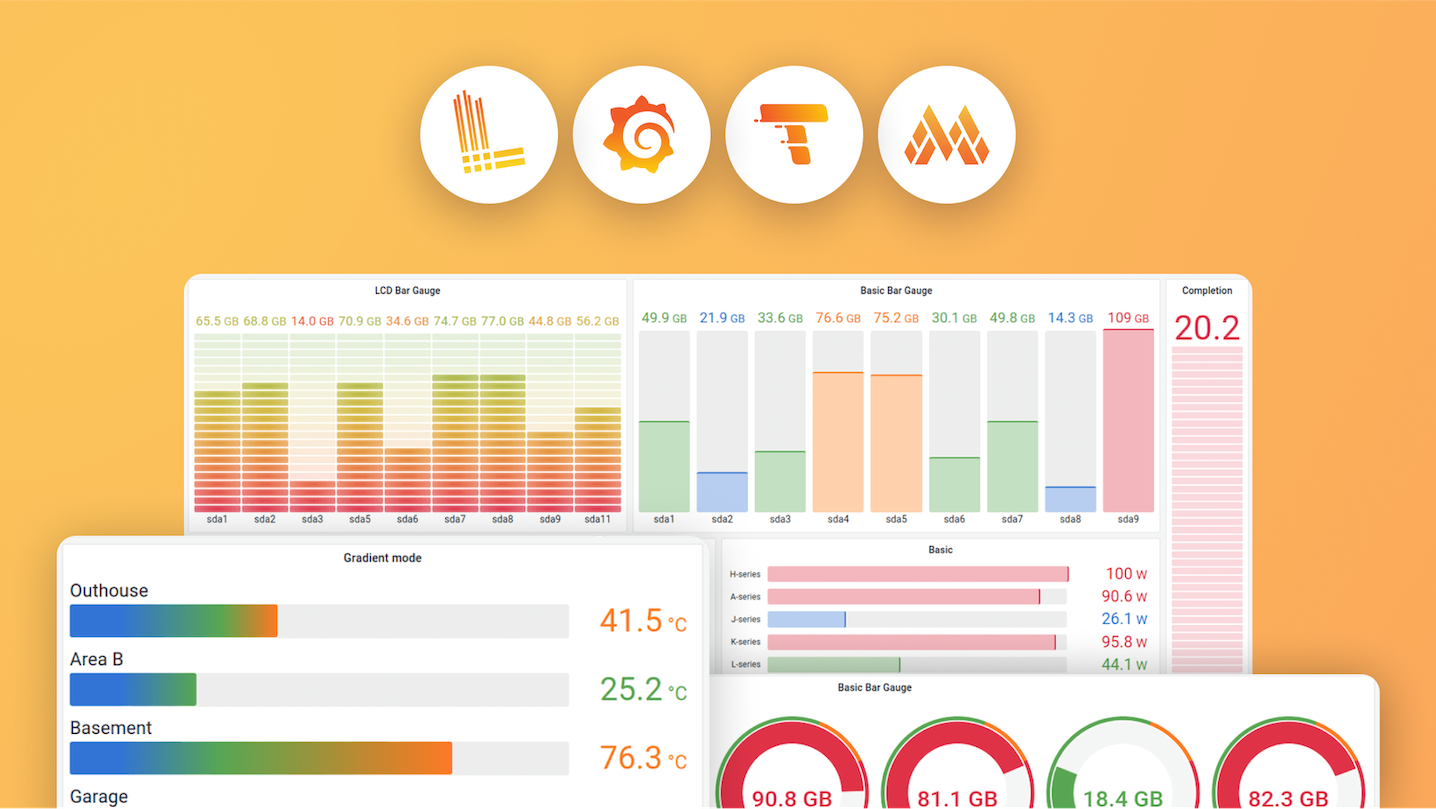
Grafana’s growing suite of visualizations, ranging from time series graphs to heatmaps to cutting-edge 3D charts, help you decode complex datasets.
Deploy dashboards and alerts in your software pipeline, so that when a service ships, so does its monitoring.

![]()
1.5M+
Active installs
![]()
67.5k
GitHub stars
![]()
2,000+
Contributors
![]()
25M+
Global users
Grafana Labs is proud to lead the development of the Grafana project. And we’re hiring!
Get Grafana fully managed with Grafana Cloud or run on your own infrastructure with self-managed options.
Centralize the analysis, visualization, and alerting for all of your data with Grafana.
For users who prefer to set up, administer, and maintain their own installation.
Offered as a fully managed service, Grafana Cloud is the fastest way to adopt Grafana and includes a scalable, managed backend for metrics, logs, and traces.
Managed and administered by Grafana Labs with free and paid options for individuals, teams, and large enterprises.
Includes a robust free tier with access to 10k metrics, 50GB logs, 50GB traces, 50GB profiles, 50k frontend sessions, and 500VUh of k6 testing for 3 users.
Grafana’s powerful visualization and alerting, enhanced with access to Enterprise data source plugins and built-in collaboration features.
For organizations that have specific privacy or security requirements and need a self-managed environment.