

Grafana 3.1.0 Released
Grafana 3.1.0 stable is now available for download!
Release Highlights
- Dashboard Repository at Grafana.net. You can now discover and upload dashboards.
- Dashboard time range and variables values are now always synced with URL.
- Constant Template Variable have been added to make dashboard sharing easier (use as metric prefix).
- Singlestat can now map ranges to text.
- Metrics Grafana now supports sending metrics about itself.
- Full changelog
Discover and share dashboards
The main new feature in this release is the ability to export dashboards in more portable format so that you can share them with others or import them into another Grafana instance without manually updating data source names or metric prefixes. The import process will now allow you specify the data sources and metric prefixes that the dashboard requires.
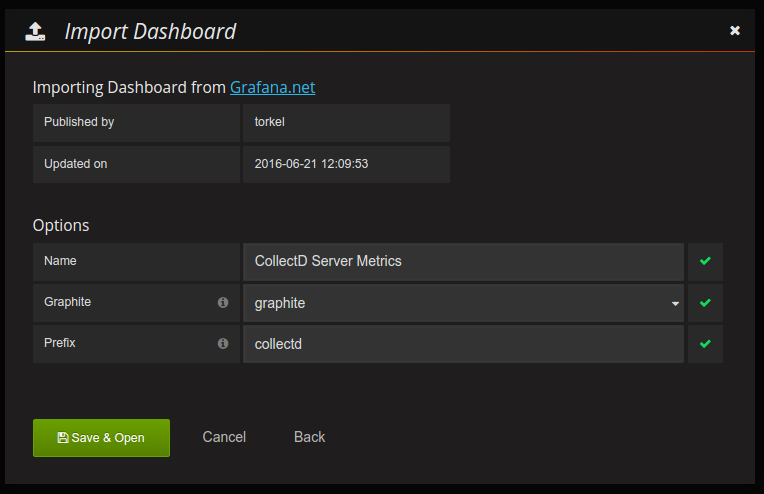
You can discover and share dashboard on Grafana.net. There are already a number of dashboards there.
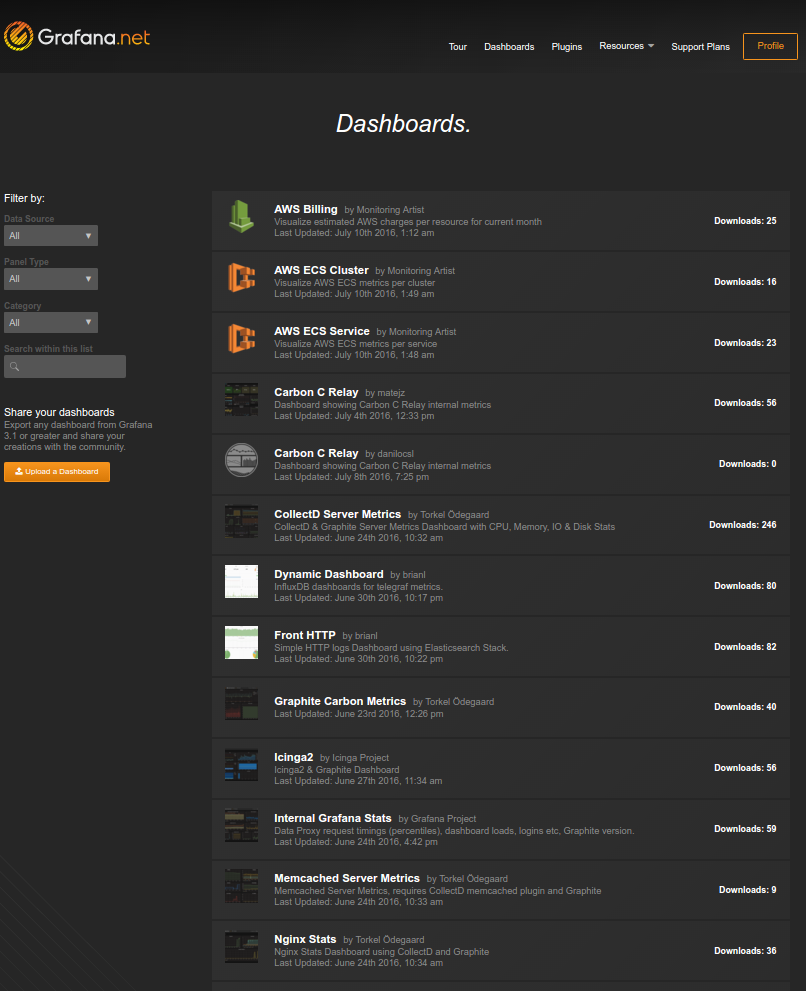
You can filter by what data source or collector you use. There are already dashboards available for Graphite, Collectd, Prometheus, node exporter, AWS CloudWatch, Memcached and Nginx.
Anyone can share a dashboard on Grafana.net, just sign in and go the profile page and then
the dashboards link in the side nav, then hit the Upload dashboard button. Remember to be
very detailed in the dashboard markdown readme section. Describe the dashboard
and every relevant detail & config for the collector you used.
Dashboard Urls
In Grafana 3.1 the current time range and template variables values are always synced to the URL. This makes it possible to always copy your current Grafana url to share with a colleague without having to use the Share modal.
Internal metrics
Do you want metrics about viewing metrics? Of course you do! In this release we added support for sending metrics about Grafana to graphite. You can configure interval and server in the config file. There is already a dashboard for internal metrics on Grafana.net named Internal Grafana Stats as well as a live demo of the dashboard on the play site. The dashboard has the following graphs:
- Data proxy request times as percentiles
- Data proxy requests / s
- Dashboard search times, load / save
- Logins
Breaking changes
- Logging format has been changed to improve log filtering.
- Graphite PNG Graphite PNG support dropped from Graph panel (use Grafana native PNG instead).
- Migration No longer possible to import dashboards from 1.x stored in ES or Influx 0.8
Thanks
A big thanks to all the Grafana users who contribute by submitting PRs, bug reports & feedback!
