

Evolving from Machines to Services
It used to be that each machine had one purpose. Your load balancer machines talked to your web server machines which talked to your database machines. Instrumentation from these systems didn’t tend to be spectacular, so the most practical approach was to rely on and page on machine metrics such as CPU. Sure it wasn’t perfect, but it caught most of the times the service got overloaded.
There’s the odd false positive. You get paged due to logrotate taking slightly longer than usual for a weekly log rotation. You get paged because during a traffic peak for one server that happens to be on older hardware than the rest. When I see CPU usage is high is I think that’s great, as I paid for that machine and I’m happy to see I’m getting good value for my money. It’s not worth getting woken up over. These are noise, not outages.
As this system grows so do the number of alerts. The more machines you have, the higher the chances are for one of the machines to be feeling under the weather and for the alerts for that machine to fire. The majority of the time nothing is wrong, your users are happily using the service and getting the expected performance levels.
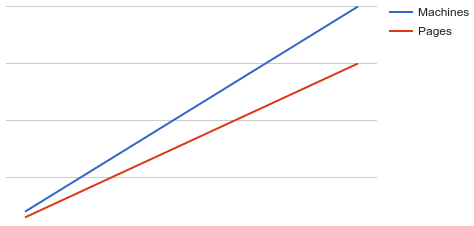
You on the other hand are dealing with ever increasing levels of unactionable pages. There’s a risk of pager fatigue, whereby there’s so many dubious pages being summarily handled that an important page might be missed. Operational load is scaling linearly, whereas you want it to be sublinear.
What’s gone wrong here?
A quick solution that was a good tradeoff initially hasn’t scaled as your system grew. You’re now getting lots of pages, but they aren’t aligned with what your users care about. How do you fix this?
Let’s go back to fundamentals. What users care about isn’t CPU on individual machines, it’s the availability, latency and error rates of the services as they perceive them. So let’s measure and alert on that!
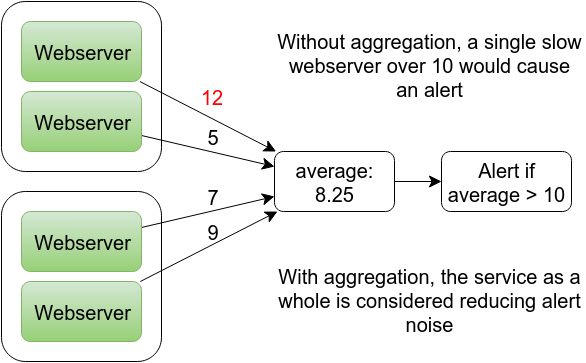
To do so you need to aggregate metrics from the machine level up to the service level, adding up the request counts, errors and latency. You can then alert on this, such as requiring 99.9% availability and less than 200ms latency.
In today’s world, having a 1:1 coupling between machines and services is becoming less common. We no longer have the webserver machine, we have one machine which hosts one part of the webserver service. That machine might also be hosting several other services as part of a microservice architecture. Alerting on machine CPU in that situation will be even noisier, especially if you have a mix of web service and batch workloads. Performance alerting based on machine metrics makes little sense in modern setups.
Monitor on services rather than machines. Have your monitoring serving you rather than you are serving your monitoring.
