Breaking the Ice Through Design
I’ve been looking forward to writing about some of the more visual-design focused projects at raintank I’ve been working on for a while. Recently, I finished designing our company business cards, which I’m pretty excited about, so now feels like the right time.
The Intersection of Data and Design
Raintank is a very design-forward company. Everyone on the core team is passionate about clarity and distilling complex ideas into elegant simplicity. Beautiful design is one of the driving forces of Grafana’s popularity and success. So when brainstorming concepts for our collateral, I wanted to marry this love of data with the very functional aspects of business cards. The idea I settled on was embedding a personalized graph into each of our team member’s cards. This served a few purposes:
- To provide a very simple visual connection back to an important part of raintank’s core offering.
- Facilitate conversation when meeting new people.
It was the second point that hit home for me. I’ve always been an introvert, probably to my professional detriment. I’m not shy, but often in conversation, I am a quiet, active listener. Many people might even be surprised to hear that I have been a touring musician in punk rock bands since I was 17. I have sung, screamed and played guitar in front of thousands of people without the slightest hesitation; crowds are no problem, it’s the more one-on-one interaction where my quiet nature exposes itself most. Striking up and maintaining conversations with new people is something I’ve never felt particularly adept at. “How about this weather”, or “how about those [insert sport-ball team name here]?” – have never been my style. Small-talk, like anything else, is a learned skill, and just like those blues pentatonic scales I have burned into muscle memory, we don’t all start off as pros– it takes practice. Armed with a beautifully designed card that has an abstract, yet compelling data visualization on it seems like a great ice breaker that can lead to more organic and meaningful conversation.
With the concept locked in, I set about designing something that’s simple yet sophisticated and supports the look of the brand we’re building, all on a 2”x3.5” piece of paper.
Research
I took this opportunity to try something new– printing techniques I’ve wanted to try, but for one reason or another didn’t feel right for the company. Anytime this happens, I try to file away the idea for another day when it might be more appropriate.
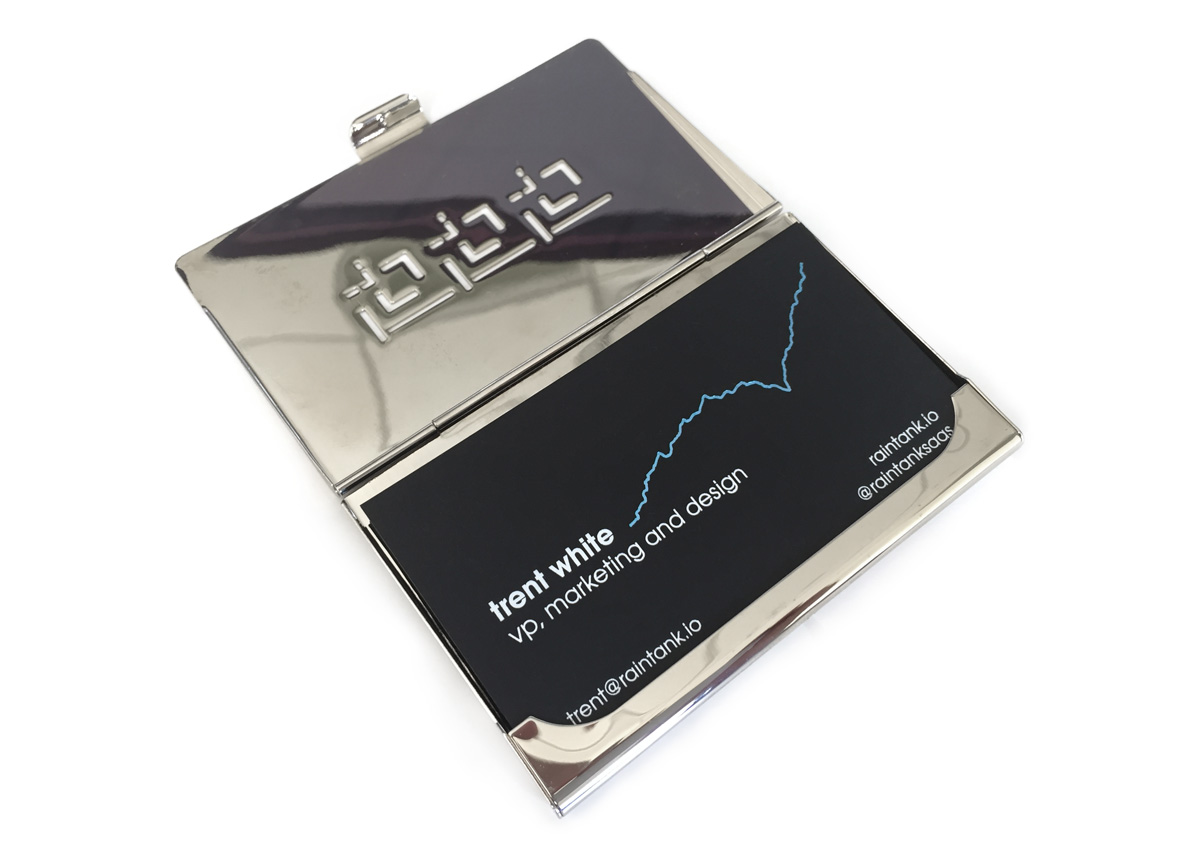
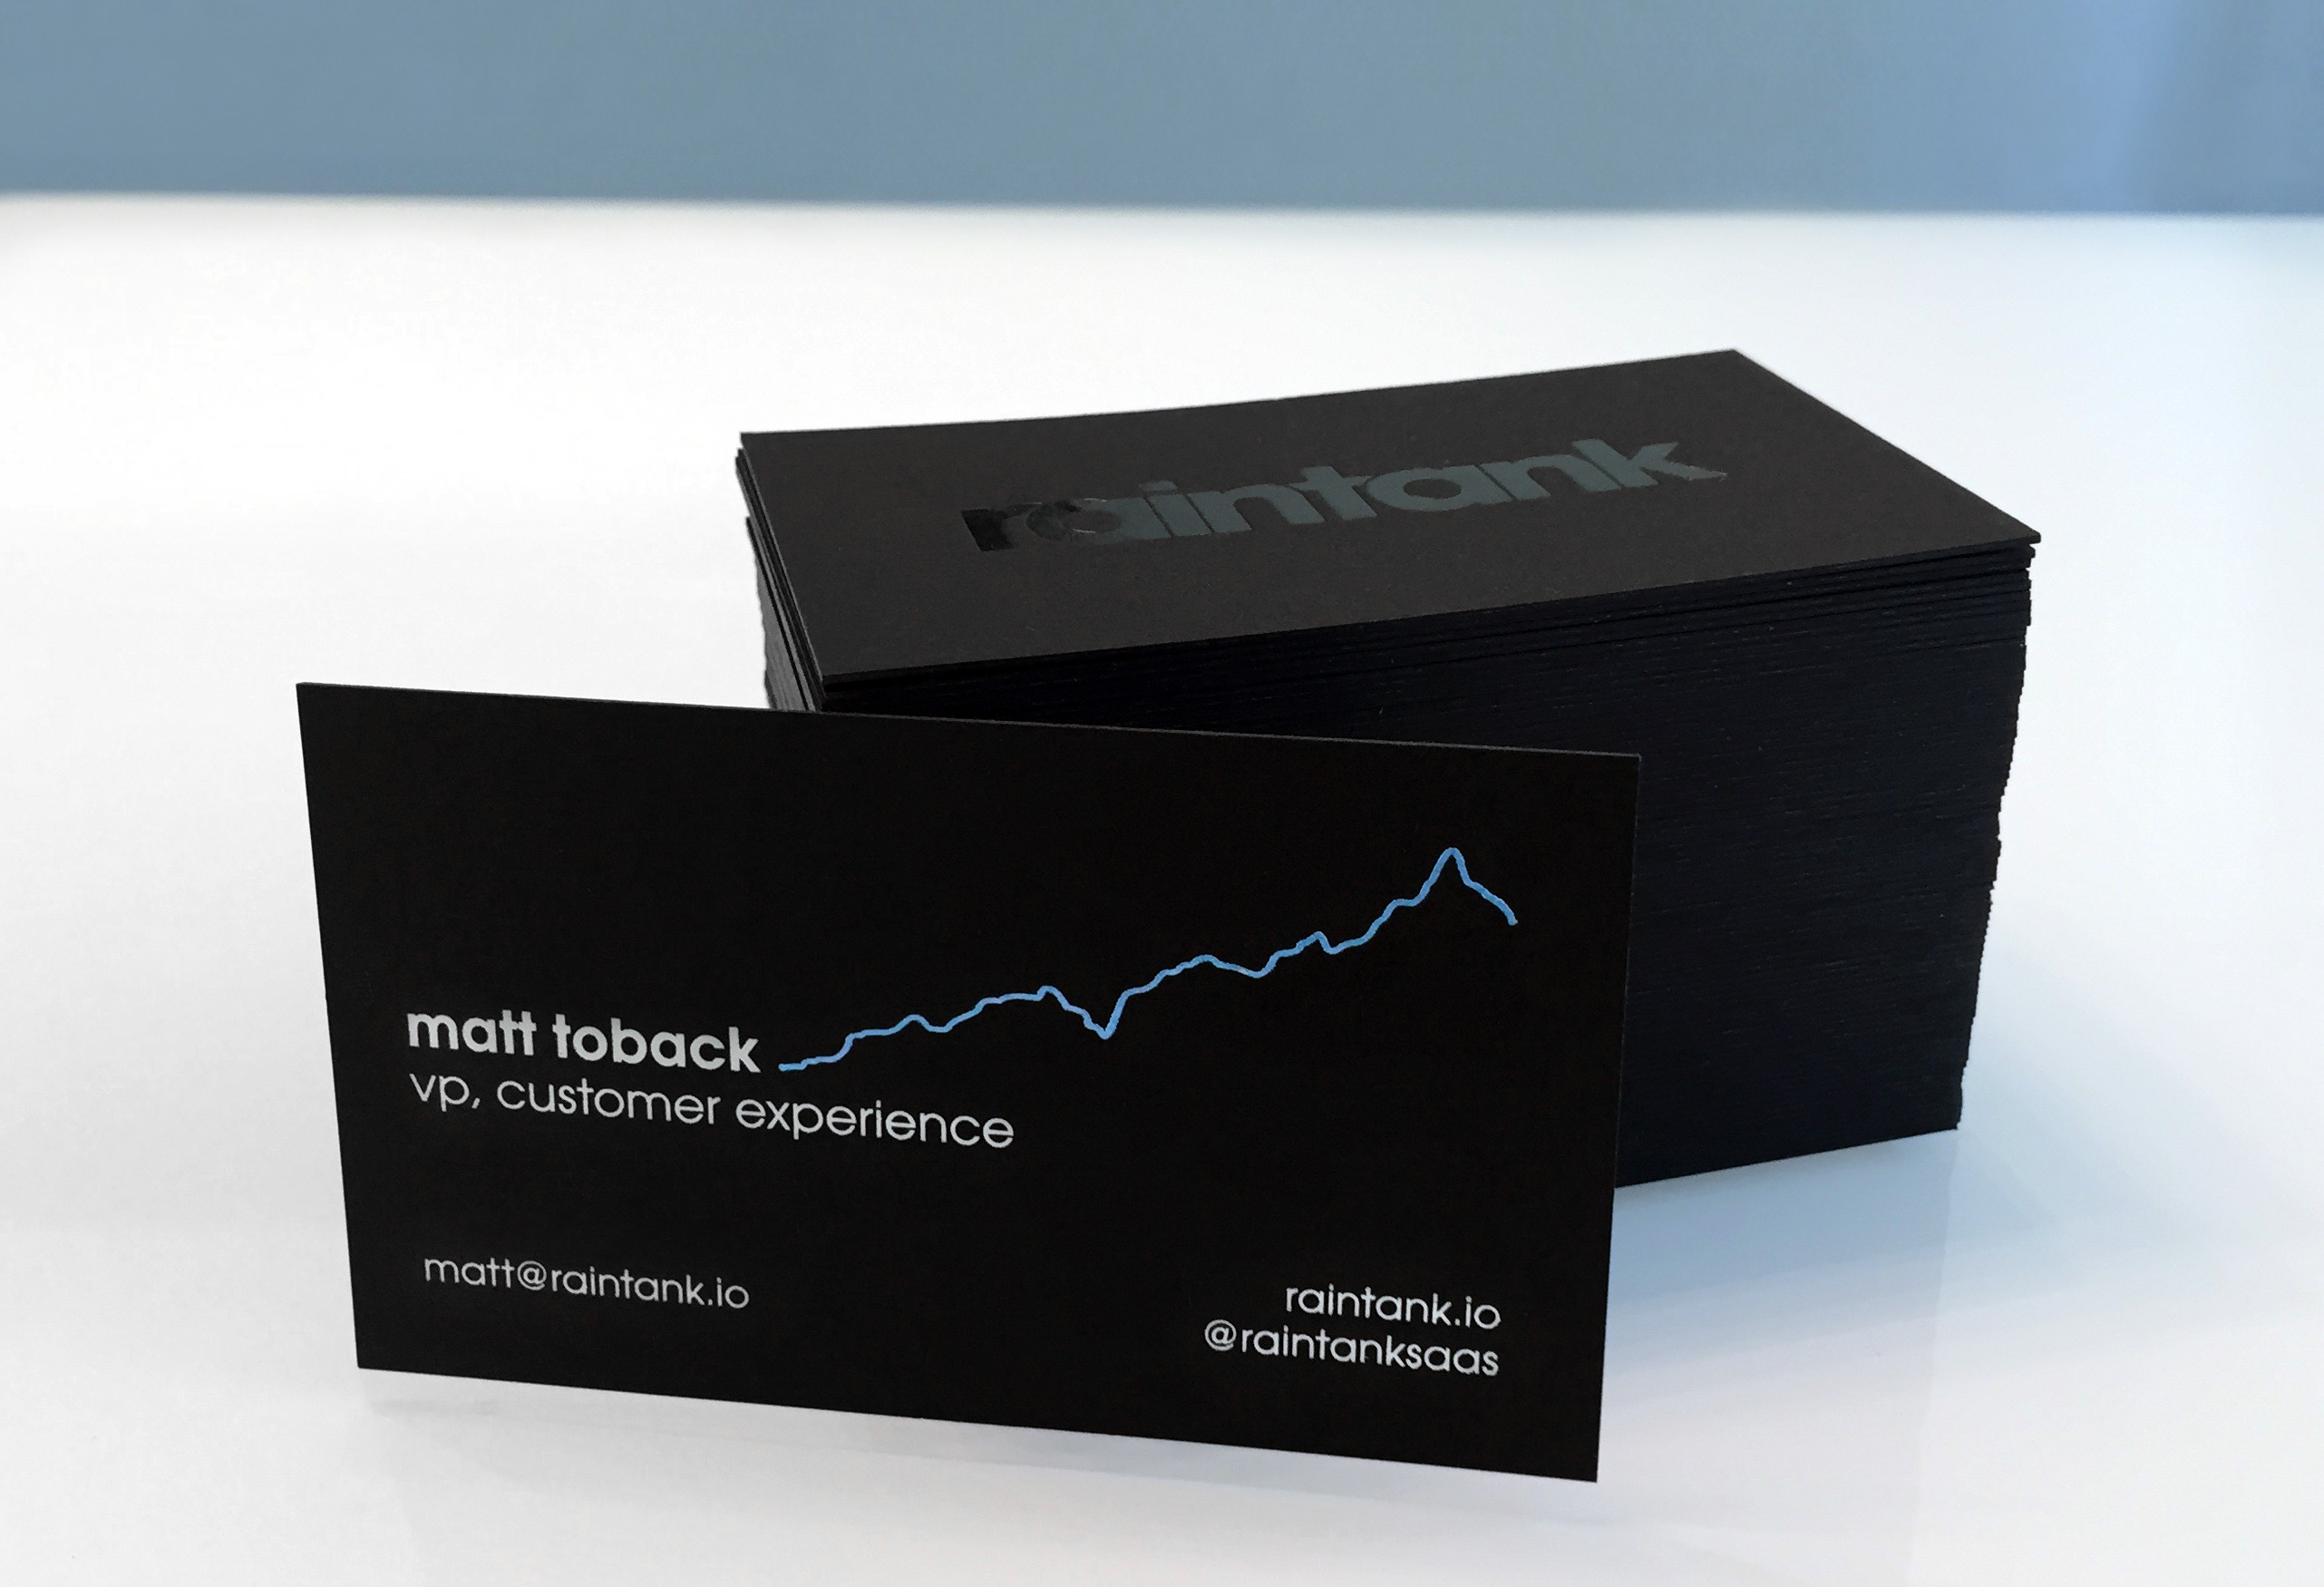
The technique I wanted to use is a reverse of a traditional business card. I wanted to use white ink on black paper to maximize the positive/negative contrast and reinforce the dark sophistication we’re leveraging in other elements. After some research I decided that we didn’t even need ink at all – we could use foil instead. The foil is transferred onto the paper and creates dimensionality – you can actually feel the texture as you touch the card. The completed design incorporates three foils: white for name and contact info, blue (which I matched closely to our main raintank-branded blue) for the graph and black for the logo on back to give it a subtle tone-on-tone effect. This would look striking and feel unique.
For the paper I looked into a few options. I wanted the card to have some heft and rigidity (which connotes quality), but I didn’t want it to be so thick that you could only carry three with you at a time – I settled on a mid-weight vellum that wasn’t too thick but still felt classy.
Design
I typically gravitate to a more minimalist style of design. For this card, I wanted something clean with generous amounts of negative space, structured information hierarchy, contemporary type, etc. I started by laying out the important information – after all, business cards are utilitarian. They cover all the basics and do the heavy lifting for future contact: name/title, contact info, website, etc. Without these, remembering the correct names with faces can be difficult, especially at conferences and networking events where it can often feel like speed dating.
I sat down with each member of the team to get the details they felt were important for their respective card. Interesting to hear the a few people requested their phone be left off. Understandable. With the waning need for desk phones, people guard their personal numbers a bit more closely. I made sure the template worked both ways.
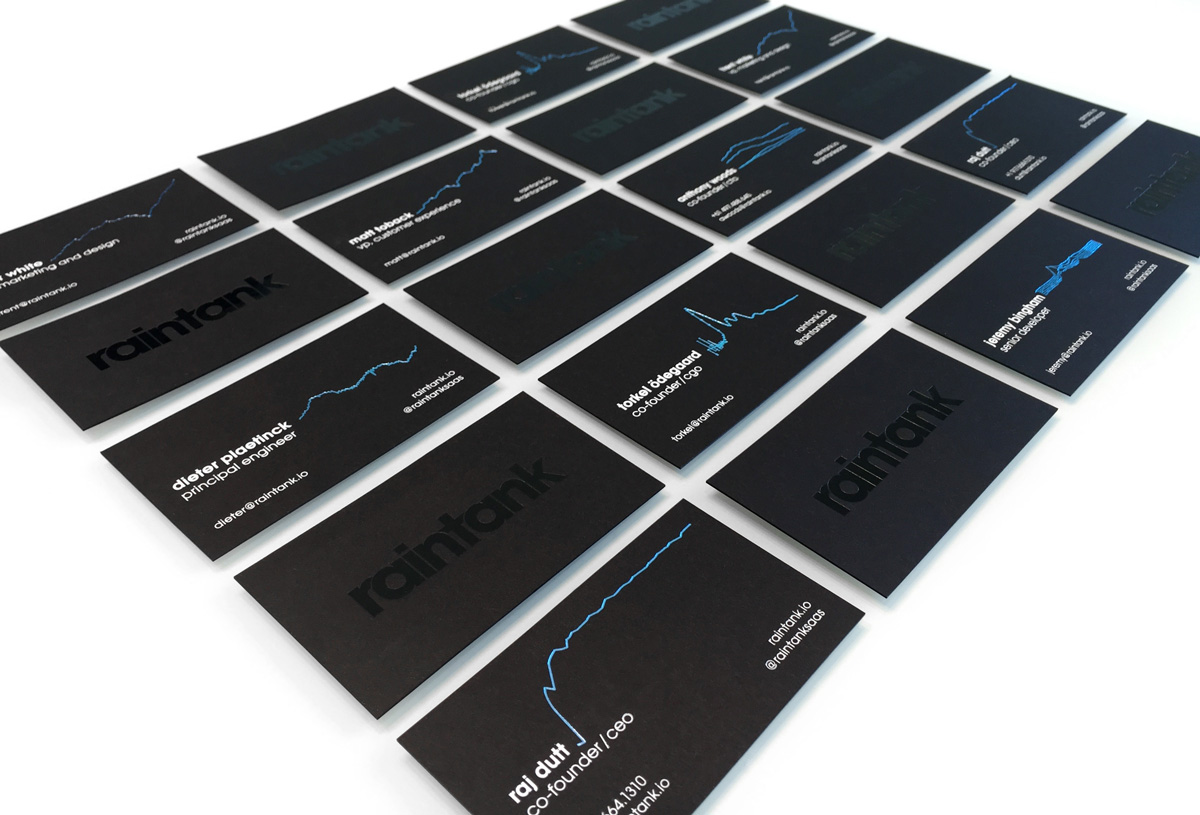
The real interesting part though, was the data visualization. I tasked each colleague with providing a graph or data, from something; anything, that was of interest to them. After all, the idea was to spark conversation – something that you’d like to chat about, or something to serve as a launching off point. Allowing the subject matter of the graph to be unique and personal, yielded fascinating and wildly differing results with equally fascinating visualizations. Removing all constraints however, can be can be a constraint of its own, so it was important to chat with everyone to help narrow down ideas to find something that can be abstracted into a simplified graph that could be represented in one color without any axis. The decision to remove the axis was allow the graphs to feel more integrated with the design and more organic. I was careful not to add additional boxes or lines to add clutter. The card design needed to feel like a unified piece, even if you weren’t yet sure of what the graph signified. The data behind the graphs vary widely from air travel safety records, anomaly detection, to a very well known radio pulsar. These graphs morph into a continuation of the name creating a unique ‘signature’ on each card.
Sitting around a table discussing these graphs gave us the opportunity to get to know a more about each other and what we find interesting. Oh, and I’ve been intentionally vague regarding exactly what my graph represents. We’ll just have to grab a drink sometime and talk about it.