
Grafana 1.8.0-rc1 Released!
New release today! v1.8.0-rc1 is now available for download.
This is probably the biggest release since the first version was released. So many new features, enhancements and general UI improvements that this will likely be a very long blog post. play.grafana.org is updated to run 1.8.0-rc1, now with InfluxDB demo dashboards. There is also a New features in v1.8 dashboard that highlights some of the new features.
Release highlights
1) Mixed graph styling
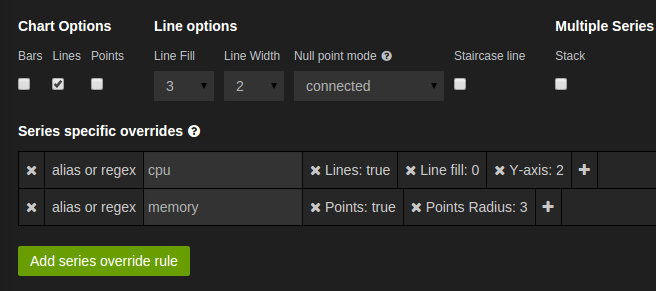
You can override any display setting for a specific series using the series name or a regex pattern. Mix bars with lines, or disable stacking for the right y-axis or any combination you can think of!
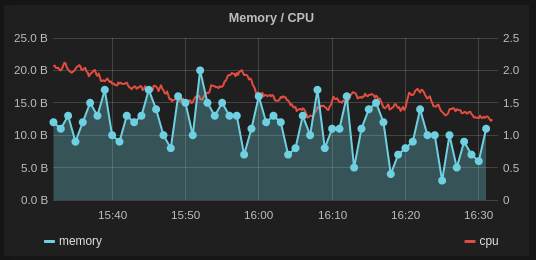
You find these options under display styles.
2) Improved templating system
The templating system has been completly rewritten. This feature was previously called filtering. From 1.8 it is renamed to templating.
Templating allows you to create variables that you can use in metric queries, annotation queries and panel titles to create generic reusable
dashboards. The new templating system uses a $variable syntax, but the old [[variable]] still works.
New templating editor

The new templating system now has full support for InfluxDB. You can extract parts of a metric name using a regex. You also have full control over how the “All” option should be formated so that it works for different data sources.
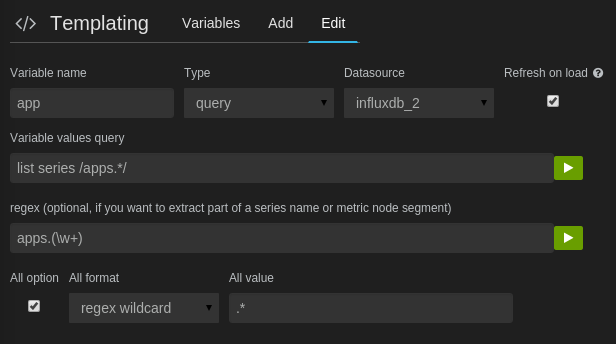
InfluxDB users should use regex wildcard or regex values for the All option format.
Graphite users should use glob or wildcard.
Variables in Graphite function parameters
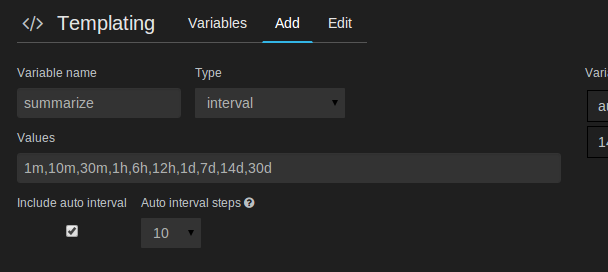
You can now use template variables for function parameters. There is a special template variable type called interval that includes
and auto value, where the interval is calculated based on the time range.

Template variable selection
When selecting template variables you now get a text box and and auto complete dropdown. Useful when you have many posible values for
a variable.
3) UI Improvements
No more modals
All editors are now shown in an edit pane under the menu. This feels much more natural and faster.
All editors have also been polished and generally look a little better.

Improved search & tags
The search results view has been given a makeover, now with colored tags.
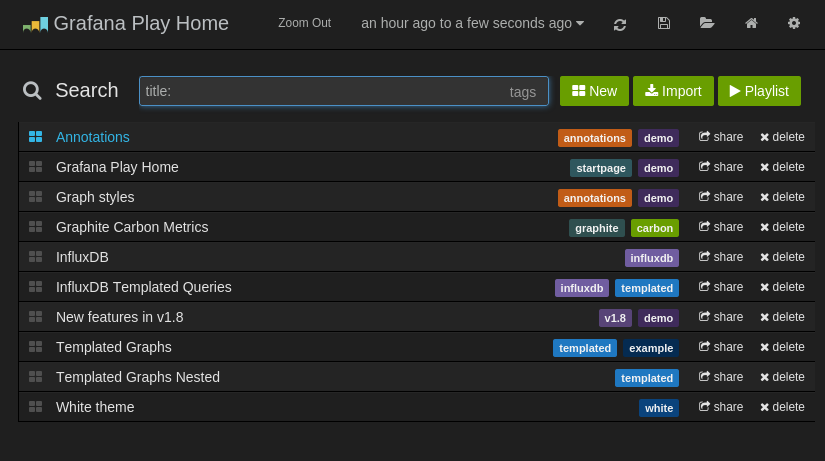
You can navigate the search results with your up/down keys. The first result is always highlighted. Hit enter to open the dashboard. You can add tags in the dashboard settings edit pane. You can hit the tab key, to focus the tags link, hit enter again to get an overview of all tags, click on the tag to filter by the tag.
4) Improved Graphite Query editor
Many graphite functions can take other series as arguments. This was something the old
query editor could not handle. But the new improved query editor allows you to use
other queries as function arguments. To refer to another query you use a letter, like #A.

Or a shorter version of the same thing:

This is very powerful as it allows you to reuse queries in complex expressions. For example plot a total and a percentage. If a query is only to be used in another query and not drawn simply hide it using the eye.
5) InfluxDB Query Editor enhancements
The query editor for InfluxDB has been upgraded. There are now two rows for each query, so more space
for potentially long series names. There is now an option to add fill(null) or fill(0). These options
are very important to understand and use because they solve some important scenarios that has troubled many
InfluxDB users.

A setting that is very important in combination with fill(0) is the new group by time option below your
queries. This option allows you to set a fixed group by time for all queries, but more importantly it allows
you to set a lower limit for the auto group by time. When using fill(0) you do not want to insert
zeros between real measurements, so you group by time must never be below the rate of writes.
A low limit for the auto group by time is set using >10s syntax. This feature together with fill(0) is important when stacking multiple
series to ensure that every series have values for every time point.
6) InfluxDB breaking changes
I am sorry to say that there are some breaking changes in 1.8 for InfluxDB users. All queries that used a where clause or raw queries needs to be updated.
Raw Queries
select mean(value) from "app.status" where $timeFilter group by time($interval) fill(0) order ascRaw queries are now required to include $timeFilter variable for time range, and zoom to work. Before
Grafana tried to parse and inject the time range filter in the right place, but this was fragile and could
lead to double time where conditions if there already was one in the query. Raw queries can now use,
optionally, a $interval variable which will be replaced with the auto group by time interval.
Where condition
In 1.7.0 you could add a single where condition, using a dropdown to select column, operation, and value. This was overly complicated, and is now replaced with a single where condition text box where you can enter any number of where conditions. If you open a graph in edit mode the editor will try to patch the query (using the old model) to build the where condition for you. But you will have to enter edit mode for this “patch” process to work.
6) Misc improvements
- Url state for panel edit and fullscreen mode, copy url and you will be taken to edit or fullscreen for that panel
- from and to date range filters can be passed via url, see Issue #787 for more details
A full share feature, where you can share a panel or dashboard with the current time range did not make it for this release. But will be coming.
7) Documentation
The documentation for the new features and changes has yet to be done. That will be the focus for next week. In the mean time, this blog post and the demo dashboards on play.grafana.org will have to suffice.
8) Download
Even though I have two project sponsors, it is not enough for me to work full time and long term on Grafana. So please pay what you think it is worth, and head to the download page for download links and a complete changelog.
NYC Grafana + InfluxDB Meetup on Oct 8th
I will be flying to New York on Oct 5th and will stay for two weeks. My project sponsor Squarespace will be hosting a meetup on Oct 8th where I and Paul Dix from InfluxDB will be speaking. Sign up for the meetup!
Meetups, Conferences & Company talks/coaching
If you want me to come talk about Grafana, application metrics, build measure learn or Graphite. Please email me at torkel@grafana.org. I live in Stockholm Sweden so travel could be an issue, but I am flexible and available :)
Cheers & keep on graphing!
Torkel
Big thanks to my sponsors

