Grafana Labs Logo
  • Products Open source Solutions Learn Company
  • Downloads Contact us Sign in
Create free account Contact us

Products

Core LGTM Stack

Logs

powered by Grafana Loki

Grafana

for visualization

Traces

powered by Grafana Tempo

Metrics

powered by Grafana Mimir and Prometheus

Expand The Stack

Plugins

Connect Grafana to data sources, apps, and more

Incident Response & Management

with Grafana Alerting, Grafana Incident, and Grafana OnCall

Performance testing

powered by Grafana k6

Deploy The Stack

Grafana Cloud

Fully managed

Grafana Enterprise

Self-managed

Pricing

Hint: It starts at FREE

Open Source

Grafana Loki

Multi-tenant log aggregation system

Grafana

Query, visualize, and alert on data

Grafana Tempo

High-scale distributed tracing backend

Grafana Mimir

Scalable and performant metrics backend

Grafana OnCall

On-call management

Grafana Phlare

Scalable continuous profiling backend

Grafana Faro

Frontend application observability web SDK

Grafana Agent

Batteries-included telemetry collector

Grafana k6

Load testing for engineering teams

Prometheus

Monitor Kubernetes and cloud native

OpenTelemetry

Instrument and collect telemetry data

Graphite

Scalable monitoring for time series data

Community resources

Dashboard templates

Try out and share prebuilt visualizations

Prometheus exporters

Get your metrics into Prometheus quickly

Featured Solutions

Kafka
Kubernetes
MongoDB
MySQL
Salesforce
See all

Learn

Stay up to date

Observability Survey 2023

Key findings and results

New

ObservabilityCON on the Road 2023

Open source observability conference

Blog

News, releases, cool stories, and more

Events

Upcoming in-person and virtual events

Success stories

By use case, product, and industry

Technical learning

Tutorials

Step-by-step guides

Documentation

All the docs

Writers’ Toolkit

Contribute to technical documentation provided by Grafana Labs

Webinars and videos

Demos, webinars, and feature tours

Join the community

Community forums

Ask the community for help

Community Slack

Real-time engagement

Company

Our team
Careers We're hiring
Events
Partnerships
Newsroom
Contact us
Search

Help build the future of open source observability software Open positions

Check out the open source projects we support Downloads

Sign in
Products

Logs

powered by Grafana Loki

Grafana

for visualization

Traces

powered by Grafana Tempo

Metrics

powered by Grafana Mimir and Prometheus

Plugins

Connect Grafana to data sources, apps, and more

Incident Response & Management

with Grafana Alerting, Grafana Incident, and Grafana OnCall

Performance testing

powered by Grafana k6

Grafana Cloud

Fully managed

Grafana Enterprise

Self-managed

Pricing

Hint: It starts at FREE


Open source Grafana Grafana Loki Grafana Mimir Grafana OnCall Grafana Tempo Grafana Agent Grafana k6 Prometheus Grafana Faro Grafana Phlare OpenTelemetry OSS Graphite
Learn

Observability Survey 2023

Key findings and results

New

ObservabilityCON on the Road 2023

Open source observability conference

Blog

News, releases, cool stories, and more

Events

Upcoming in-person and virtual events

Success stories

By use case, product, and industry

Tutorials

Step-by-step guides

Documentation

All the docs

Writers’ Toolkit

Contribute to technical documentation provided by Grafana Labs

Webinars and videos

Demos, webinars, and feature tours

Community forums

Ask the community for help

Community Slack

Real-time engagement


Company Our team Careers Events Partnerships Newsroom Contact us

Core LGTM Stack

Logs

powered by Grafana Loki

Grafana

for visualization

Traces

powered by Grafana Tempo

Metrics

powered by Grafana Mimir and Prometheus

Expand The Stack

Plugins

Connect Grafana to data sources, apps, and more

Incident Response & Management

with Grafana Alerting, Grafana Incident, and Grafana OnCall

Performance testing

powered by Grafana k6

Deploy The Stack

Grafana Cloud

Fully managed

Grafana Enterprise

Self-managed

Pricing

Hint: It starts at FREE

Get Started

Free Forever plan:

  • 10,000 series metrics
  • 14-day retention
  • 50 GB of logs
  • 50 GB of traces
  • 500 VUh of k6 testing
  • 3 team members
  • Grafana, of course
Create free account

Grafana Loki

Multi-tenant log aggregation system

Grafana

Query, visualize, and alert on data

Grafana Tempo

High-scale distributed tracing backend

Grafana Mimir

Scalable and performant metrics backend

Grafana OnCall

On-call management

Grafana Phlare

Scalable continuous profiling backend

Grafana Faro

Frontend application observability web SDK

Grafana Agent

Batteries-included telemetry collector

Grafana k6

Load testing for engineering teams

Prometheus

Monitor Kubernetes and cloud native

OpenTelemetry

Instrument and collect telemetry data

Graphite

Scalable monitoring for time series data

Community resources

Dashboard templates

Try out and share prebuilt visualizations

Prometheus exporters

Get your metrics into Prometheus quickly

Featured Solutions

Kafka
Kubernetes
MongoDB
MySQL
Salesforce
See all

Stay up to date

Observability Survey 2023

Key findings and results

New

ObservabilityCON on the Road 2023

Open source observability conference

Blog

News, releases, cool stories, and more

Events

Upcoming in-person and virtual events

Success stories

By use case, product, and industry

Technical learning

Tutorials

Step-by-step guides

Documentation

All the docs

Writers’ Toolkit

Contribute to technical documentation provided by Grafana Labs

Webinars and videos

Demos, webinars, and feature tours

Join the community

Community forums

Ask the community for help

Community Slack

Real-time engagement

Featured

Grafana 9.0 demo video

We’ll demo all the highlights of the major release: new and updated visualizations and themes, data source improvements, and Enterprise features.

Watch now →
Our team
Careers We're hiring
Events
Partnerships
Newsroom
Contact us

Blog / Authors

RSS

All articles by

Joey Bartolomeo

Joey Bartolomeo
Why implementing Grafana Enterprise was a bright idea for U.K. energy supplier Utilita

Why implementing Grafana Enterprise was a bright idea for U.K. energy supplier Utilita

3 min   |   17 Mar 2021

How using Grafana (and plugins) gave a jolt to Smart State Technology, a company advancing technology for energy infrastructures

How using Grafana (and plugins) gave a jolt to Smart State Technology, a company advancing...

7 min   |   6 Jan 2021

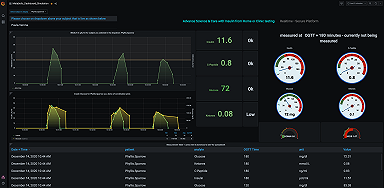
How Grafana is helping the DIFFERENCE Foundation visualize medical data in their fight against a global pandemic

How Grafana is helping the DIFFERENCE Foundation visualize medical data in their fight against a...

6 min   |   14 Dec 2020

ObservabilityCON Day 4 recap: a panel discussion on observability (and its future), the benefits of Chaos Engineering, and an observability demo showcase

ObservabilityCON Day 4 recap: a panel discussion on observability (and its future), the benefits of...

8 min   |   30 Oct 2020

ObservabilityCON Day 1 recap: Loki 2.0 and Grafana Tempo announced, real-time observability with Redis, Grafana demos, a tester's perspective, and more

ObservabilityCON Day 1 recap: Loki 2.0 and Grafana Tempo announced, real-time observability with...

8 min   |   27 Oct 2020

Inside Grafana Labs: More workspaces revealed

Inside Grafana Labs: More workspaces revealed

8 min   |   4 Sep 2020

[KubeCon + CloudNativeCon EU recap] Getting some Thanos into Cortex while scaling Prometheus

[KubeCon + CloudNativeCon EU recap] Getting some Thanos into Cortex while scaling Prometheus

17 min   |   19 Aug 2020

Grafana Labs' secrets to building and supporting a happy team

Grafana Labs' secrets to building and supporting a happy team

12 min   |   29 Jun 2020

How Hiya migrated to Grafana Cloud to cut costs and gain control over its metrics

How Hiya migrated to Grafana Cloud to cut costs and gain control over its metrics

8 min   |   4 Jun 2020

GrafanaCONline Day 9 recap: Prometheus rate queries explained, and inside one company's adoption of a central telemetry platform

GrafanaCONline Day 9 recap: Prometheus rate queries explained, and inside one company's adoption of...

2 min   |   28 May 2020

Newsletter

Want to stay on top of Grafana and Observability news? Sign up for our newsletter.


  • ««
  • «
  • 1
  • 2
  • 3
  • 4
  • »
  • »»
grot Sign up for Grafana stack updates
Note: By signing up, you agree to be emailed related product-level information.

Grafana Labs Logo

  • Grafana
  • Overview
  • Deployment options
  • Plugins
  • Dashboards
  • Products
  • Grafana Alerting
  • Grafana Cloud
  • Grafana Cloud Status
  • Grafana Enterprise Stack
  • Grafana Incident
  • Grafana OnCall
  • Open Source
  • Grafana
  • Grafana Loki
  • Grafana Mimir
  • Grafana OnCall
  • Grafana Tempo
  • Grafana Agent
  • Grafana k6
  • Prometheus
  • Grafana Faro
  • Grafana Phlare
  • OpenTelemetry
  • Grafana Tanka
  • Graphite
  • GitHub
  • Learn
  • Grafana Labs Blog
  • Documentation
  • Downloads
  • Community
  • Grafana ObservabilityCON
  • GrafanaCON 2023
  • Golden Grot Awards
  • Successes
  • Training
  • Videos
  • OSS vs Cloud
  • Company
  • The team
  • Press
  • Careers
  • Events
  • Partnerships
  • Contact
  • Getting help

Grafana Cloud Status
Sitemap
Legal and Security
Terms of Service
Privacy Policy
Trademark Policy
Copyright 2023 © Grafana Labs
Grafana Labs uses cookies for the normal operation of this website. Learn more.