Grafana Labs Logo
  • Products Open source Solutions Learn Company
  • Downloads Contact us Sign in
Create free account Contact us

Products

The Grafana Stack

Visualization

with Grafana

Metrics

with Mimir, Prometheus,
and Graphite

Logs

with Loki

Traces

with Tempo

Cloud Self-managed

Pricing

Pricing overview

Other cool stuff

OSS vs. Cloud

Dashboards

Plugins

Alerts

Load testing with Grafana k6

Grafana Machine Learning

Grafana OnCall

Open Source

Grafana
Prometheus
Grafana Loki
Grafana Mimir
Grafana Tempo
Graphite
Grafana k6
OpenTelemetry

Featured Solutions

Kafka
Kubernetes
MongoDB
MySQL
Salesforce
See all

Learn

Blog
Success stories
Community
Documentation
Webinars and videos
Events
Tutorials
Exporters
Grafana University

Company

Our team
Careers We're hiring
Partnerships
Newsroom
Grafana store
Contact us
Search

Help build the future of open source observability software Open positions

Check out the open source projects we support Downloads

Sign in
Products

Visualization

with Grafana

Metrics

with Mimir, Prometheus,
and Graphite

Logs

with Loki

Traces

with Tempo

Pricing overview
OSS vs. Cloud
Dashboards
Plugins
Alerts
Load testing with Grafana k6
Grafana Machine Learning
Grafana OnCall

Open source Grafana Prometheus Grafana Loki Grafana Mimir Grafana Tempo Graphite Grafana k6 OpenTelemetry
Learn Blog Success stories Community Documentation Webinars and videos Events Tutorials Exporters Grafana University
Company Our team Careers Partnerships Newsroom Grafana store Contact us

The Grafana Stack

Visualization

with Grafana

Metrics

with Mimir, Prometheus,
and Graphite

Logs

with Loki

Traces

with Tempo

Cloud Self-managed

Pricing

Pricing overview

Other cool stuff

OSS vs. Cloud
Dashboards
Plugins
Alerts
Load testing with Grafana k6
Grafana Machine Learning
Grafana OnCall

Get Started

Free Forever plan:

  • 10,000 series metrics
  • 14-day retention
  • 50 GB of logs
  • 50 GB of traces
  • 3 team members
  • Grafana, of course
Create free account
Grafana
Prometheus
Grafana Loki
Grafana Mimir
Grafana Tempo
Graphite
Grafana k6
OpenTelemetry

Featured Solutions

Kafka
Kubernetes
MongoDB
MySQL
Salesforce
See all
Blog Success stories Community Documentation Webinars and videos Events Tutorials Exporters Grafana University

Webinar spotlight

We'll demo all the highlights of the major release: new and updated visualizations and themes, data source improvements, and Enterprise features.

Grafana 8.0 demo video

We'll demo all the highlights of the major release: new and updated visualizations and themes, data source improvements, and Enterprise features.

Watch now →
Our team
Careers We're hiring
Partnerships
Newsroom
Grafana store
Contact us

Blog / Authors

RSS

All articles by

Dieter Plaetinck

Dieter Plaetinck
Dieter loves programming, mountain biking, and writing his own bio.
@Dieter_be
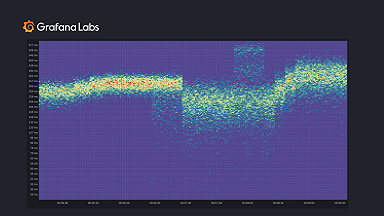
How sparse histograms can improve efficiency, precision, and mergeability in Prometheus TSDB

How sparse histograms can improve efficiency, precision, and mergeability in Prometheus TSDB

10 min   |   3 Nov 2021

How to stream Graphite metrics to Grafana Cloud using carbon-relay-ng

How to stream Graphite metrics to Grafana Cloud using carbon-relay-ng

5 min   |   3 Aug 2020

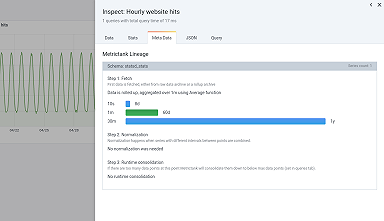
Improving Graphite rollup and runtime consolidation in Metrictank and Grafana 7.0 with lineage metadata

Improving Graphite rollup and runtime consolidation in Metrictank and Grafana 7.0 with lineage...

8 min   |   4 May 2020

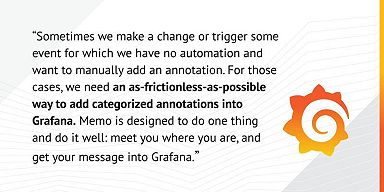
Pro Tip: Instantly Turn Slack Messages into Grafana Annotations with the Memo Tool

Pro Tip: Instantly Turn Slack Messages into Grafana Annotations with the Memo Tool

3 min   |   12 Feb 2020

Metrics Documentation with the metrics2docs Tool

Metrics Documentation with the metrics2docs Tool

3 min   |   5 Nov 2019

Coming Soon: Seamless and Cost-Effective Meta Tags for Metrictank

Coming Soon: Seamless and Cost-Effective Meta Tags for Metrictank

6 min   |   16 Jul 2019

Metrictank meta tags

Metrictank meta tags

6 min   |   9 Apr 2019

Practical fault detection: redux. Next-generation alerting now as presentation

Practical fault detection: redux. Next-generation alerting now as presentation

3 min   |   10 Dec 2016

25 Graphite, Grafana and Statsd gotchas

25 Graphite, Grafana and Statsd gotchas

28 min   |   3 Mar 2016

Transplanting go packages for fun and profit

Transplanting go packages for fun and profit

10 min   |   2 Sep 2015

Newsletter

Want to stay on top of Grafana and Observability news? Sign up for our newsletter.


waving hand emoji

Keep up with us.
Product developments and observability innovations.


Grafana Labs Logo

  • Grafana
  • Overview
  • Deployment options
  • Plugins
  • Dashboards
  • Products
  • Grafana Cloud
  • Grafana Cloud Status
  • Grafana Enterprise Stack
  • Grafana OnCall
  • Open Source
  • Grafana
  • Prometheus
  • Grafana Loki
  • Grafana Mimir
  • Grafana Tempo
  • Metrictank
  • Graphite
  • Grafana k6
  • Tanka
  • OpenTelemetry
  • GitHub
  • Learn
  • Grafana Labs Blog
  • Documentation
  • Downloads
  • Community
  • Grafana ObservabilityCON
  • GrafanaCON
  • Successes
  • Training
  • Videos
  • Company
  • Our mission
  • The team
  • Press
  • Careers
  • Events
  • Partnerships
  • Contact

Grafana Cloud Status

Sitemap

Legal and Security
Terms of Service
Trademark Policy
Copyright 2022 © Grafana Labs
Grafana Labs uses cookies for the normal operation of this website. Learn more.