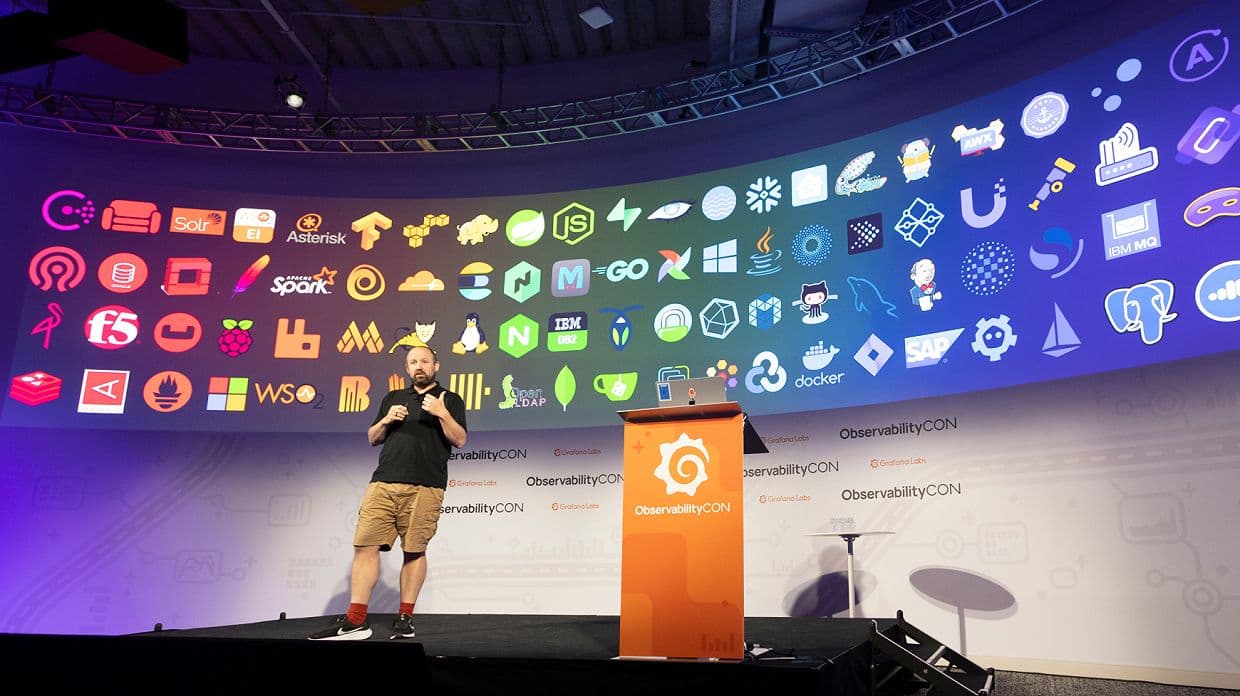
Why you don’t want to miss this one-day event

Preview new AI features and Grafana Cloud solutions
Learn how to leverage new AI features and observability tools from Grafana Labs for deeper insights into application performance, improved end user experiences, and faster root cause analysis.

Deepen your OSS observability expertise
Attend technical deep dive sessions to sharpen your skills, and don’t miss the keynote to see what’s new and next in open source observability.

Drive bigger business impact
Leave with actionable tips for growing your observability strategy to optimize performance, increase revenue, and boost customer satisfaction at your organization.

Connect with Grafana Labs experts
Get your technical questions answered by Grafana Labs experts, try out new features in hands-on demos, and learn from power users in your region at customer success sessions.
Agenda
- 9:00 AM
- 1 hour
Registration & breakfast
- 10:00 AM
- 1 hour
Opening Keynote
Join Grafana Labs to kickoff ObservabilityCON on the Road with the latest in AI-powered observability in Grafana Cloud. Learn how we’re evolving our open observability cloud to help teams detect, understand, and act faster. At Grafana Labs, open has always been our strategy: open source, open standards, open data, and open minds. As complexity grows and AI reshapes how teams build and operate software, learn how that open strategy is helping organizations get value from their telemetry and turn signals into action – and observability into competitive advantage.
- Marc ChipourasVP, Emerging ProductsGrafana Labs
- Anthony WoodsCo-FounderGrafana Labs
- 11:00 AM
- 30 minutes
Full-stack observability: Faster root cause analysis with Grafana Cloud’s knowledge graph
Systems are more vast and complex than ever, so it’s not as simple as monitoring just applications or just your infrastructure – you need observability across your full stack. On top of that, it’s not effective to view signals in isolation; modern-day services are so intertwined, that triaging problems down to the root cause requires an easy way to see how different services are connected to each other and to be able to quickly traverse across these connections.
In this session, members of the Grafana Labs team will demonstrate how the Grafana Cloud knowledge graph makes proactive and intelligent full-stack observability possible, and how Grafana Cloud’s solutions across the application, Kubernetes, and database layers – seamlessly tied together by the knowledge graph – all play a role in identifying the root cause faster.
- Brian StinehartStaff Solutions EngineerGrafana Labs
- 11:30 AM
- 30 minutes
Morning break
- 12:00 PM
- 30 minutes
From dashboards to decisions: How agentic AI is reshaping observability
AI is transforming observability from a manual, expert-driven process into a collaborative, intelligent experience. In this talk, members of the Grafana Labs team, will show how Grafana’s agentic AI systems help users write queries, run investigations, manage dashboards, and resolve incidents while only using natural language. They will also share the lessons they learned building context-aware agents, addressing coordination challenges, and measuring quality with benchmarks. Finally, they’ll discuss why a single-pane-of-glass foundation is crucial for a future of truly intelligent agentic systems.
- Anton KolesnikovSenior Software Engineer, PyroscopeGrafana Labs
- 12:30 PM
- 30 minutes
Build a better reliability culture with AI + Grafana Cloud IRM, SLO, and Alerting
How do you build a reliability culture that scales—one that’s proactive, repeatable, and resilient? At Grafana Labs, we believe the answer lies in cultural maturity, enabled by a unified, observability-native IRM platform that connects people, processes, and tools. In this session, members of the Grafana Labs team will share how Grafana Cloud is helping teams move beyond reactive incident response with a unified, observability-native platform for IRM, SLOs, alerting, and postmortems. You’ll see how we’re embedding AI across the incident lifecycle to reduce noise, accelerate resolution, and turn incidents into continuous learning opportunities. Detect: Alerts now include more observability context via alert enrichment, automatically delivered to Slack and mobile. We’ll show how this – combined with new IRM webhook and workflow features – enables custom, context-rich workflows tailored to your tools and teams. Respond: See how the latest AI functionality and deep integration with Grafana transform incident response – surfacing related incidents, graphs, logs, and even recommended actions, keeping humans in control while reducing cognitive load. Learn: Post-incident reviews are no longer a chore with Service Center, which automates tagging, connects themes, and turns scattered incident notes into operational excellence reviews, all in one place. This is IRM reimagined for an AI-native world—built into your observability stack, not bolted on. Join us to learn how the right systems and cultural mindset can transform how your teams build and operate reliable software.
- Sean MaritzStaff Observability ArchitectGrafana Labs
- 1:00 PM
- 25 minutes
From Fragmented Monitoring to Unified Observability: Tally Group’s Journey to Proactive Operations with Grafana Cloud
Tally Group – a global provider of innovative billing, customer experience, and energy management solutions – relied on a patchwork of monitoring tools that left teams without a unified view of system health. Metrics, logs, alerts, and incident response all lived in separate systems, which meant the team had no application-level observability or centralized on-call process. This fragmentation forced engineers into a reactive posture, made end-to-end behavior difficult to understand, and slowed down troubleshooting when issues arose.
Join Senior DevOps Engineer John Bulauan as he walks through how Grafana Cloud became Tally Group’s “one-stop shop” for observability – bringing together dashboards, alerts, synthetic checks, logs, metrics, and on-call schedules in one place. With Grafana Cloud Application Observability fully implemented, teams now detect issues earlier, resolve incidents faster, and operate proactively instead of reactively. See how John's team is now moving on to building an automated performance testing framework powered by Grafana Cloud k6 and how you can use these lessons to help modernize your own observability practices.
- John BulauanSenior DevOps EngineerTally Group
- 1:25 PM
- 1 hour
Lunch & expo
- 2:25 PM
- 45 minutes
Smarter observability with Grafana Cloud: Collect the data you need, when you need it, and know what it costs
In this session, you’ll learn how Grafana Cloud ensures that you’re collecting exactly the data you need, when you need it – and that you understand what it costs too. Grafana Labs team members will demo the latest additions to the Adaptive Telemetry suite, which dynamically adjusts what data gets ingested based on your usage patterns and signals from your infrastructure. Building on the success of Adaptive Metrics and Adaptive Logs, Adaptive Traces and Adaptive Profiles are designed to make every byte worthy of your attention. They will also showcase new capabilities that help you understand what that data means, including automated performance and cost-optimization recommendations from your profiling data, and an LLM-powered approach to trace analysis that surfaces patterns and spans of interest, so you can spend less time searching and more time solving. Finally, they’ll introduce our revamped billing experience, featuring granular cost attribution, support for the open source FOCUS standard, and a new alerting flow that helps you avoid surprise bills. These improvements are built with FinOps in mind – empowering teams to understand and own their share of observability costs. Whether you’re chasing performance, reliability, or efficiency, Grafana Cloud’s telemetry backends built on Loki, Tempo, Mimir, and Pyroscope are evolving to do more of the heavy lifting for you.
- George Liu Senior Solutions Engineer Grafana Labs
- 3:10 PM
- 25 minutes
How Dubber modernized observability with Grafana Cloud and adaptive metrics
Dubber is a cloud-native SaaS provider delivering call recording and voice intelligence at scale, where reliability, compliance, and insight are critical. The platform engineering team faced a familiar challenge: supporting complex, high-volume workloads on AWS and Azure with significantly fewer resources. Their existing observability stack, built on Amazon Managed Prometheus and open-source Grafana alongside OpenSearch, was costly to operate, difficult to scale, and heavily dependent on manual incident triage by an outsourced response team. As operational pressure increased, the opportunity cost of maintaining the status quo became impossible to ignore.
In this session, Dubber shares how they rethought observability using Grafana Cloud Metrics and Logs, Synthetic Monitoring, and Kubernetes Monitoring to simplify operations while reducing total cost of ownership. By aligning closely with their cloud-native architecture and existing Prometheus-based tooling, the team achieved faster time to value with minimal disruption during a critical EKS migration. Adaptive Metrics played a key role in controlling cardinality and cost, while improved visibility and filtering reduced the manual burden on incident response. Join Sai Haritha Rampe, Head of Platform Engineering, as she walks through Dubber’s evaluation process, proof of concept, and the technical and organizational outcomes of building a more resilient, scalable observability platform.
- Sai Haritha RampeHead of Platform EngineeringDubber
- 3:35 PM
- 35 minutes
Afternoon break
- 4:05 PM
- 30 minutes
Deploying OpenTelemetry with Grafana Cloud
In the 2025 Observability Survey, 71% of respondents reported that their organization is using both OpenTelemetry and Prometheus, and more than half said their investment in both has grown year over year. It’s clear that users want open standards and businesses demand quick and extensible coverage of their estate. But while OpenTelemetry and Prometheus provide great standards and protocols, there are many choices that need to be made by teams in order to adopt and get the full value of both at scale. In this session, Grafana Labs team members will demo Grafana Cloud’s native support for both OpenTelemetry and Prometheus, leveraging Grafana Beyla for eBPF-based autoinstrumentation and Grafana Alloy, a distribution of the OpenTelemetry Collector with built-in Prometheus pipelines, as a production-grade, optimized collector for open standards. The speakers will also discuss the Fleet Management feature and new developments like the instrumentation hub that enable customization at enterprise scale, increased productivity, and cost efficiency for ingest.
- Hugh BlemingsEngineering DirectorGrafana Labs
- 4:35 PM
- 30 minutes
Reliability from the outside in: How Grafana Cloud helps you see what your users experience
Observability traditionally begins inside your systems: logs, metrics, and traces that describe what’s happening behind the scenes. But your users don’t see that. They experience your product through browsers, APIs, and response times. To truly ensure reliability, you need visibility from the outside in. In this session, members of the Grafana Labs team will show how Grafana Cloud brings together three powerful tools – Synthetic Monitoring, Grafana Cloud k6 performance testing, and Frontend Observability – to help teams understand and improve what users actually experience. You’ll learn how to use the Grafana stack to answer questions like: Is my login flow reliable across regions? Are key APIs holding up under load? Are real users seeing degraded experiences? Whether you’re an SRE, performance engineer, or platform team lead, this talk will show you how to go beyond internal metrics and get a user-centric view of reliability – one that lets you act before your users feel the pain.
- Ankur DubeySenior Solutions EngineerGrafana Labs
- 5:05 PM
- 1 hour
Reception & expo
Thank you to our sponsors
Become a sponsor
Email us at sponsors@grafana.com for more information.


