
Your
stack
Get there much faster. From dashboards to centralized observability.

The (actually useful) free forever plan
Grafana, of course +
10K series Prometheus metrics,
50GB logs, 50GB traces, 50GB profiles,
500VUh k6 testing


Compose and scale observability with one or all pieces of the stack

Play around with the Grafana Stack
Experience Grafana for yourself, no registration or installation needed.
Upcoming and recent events
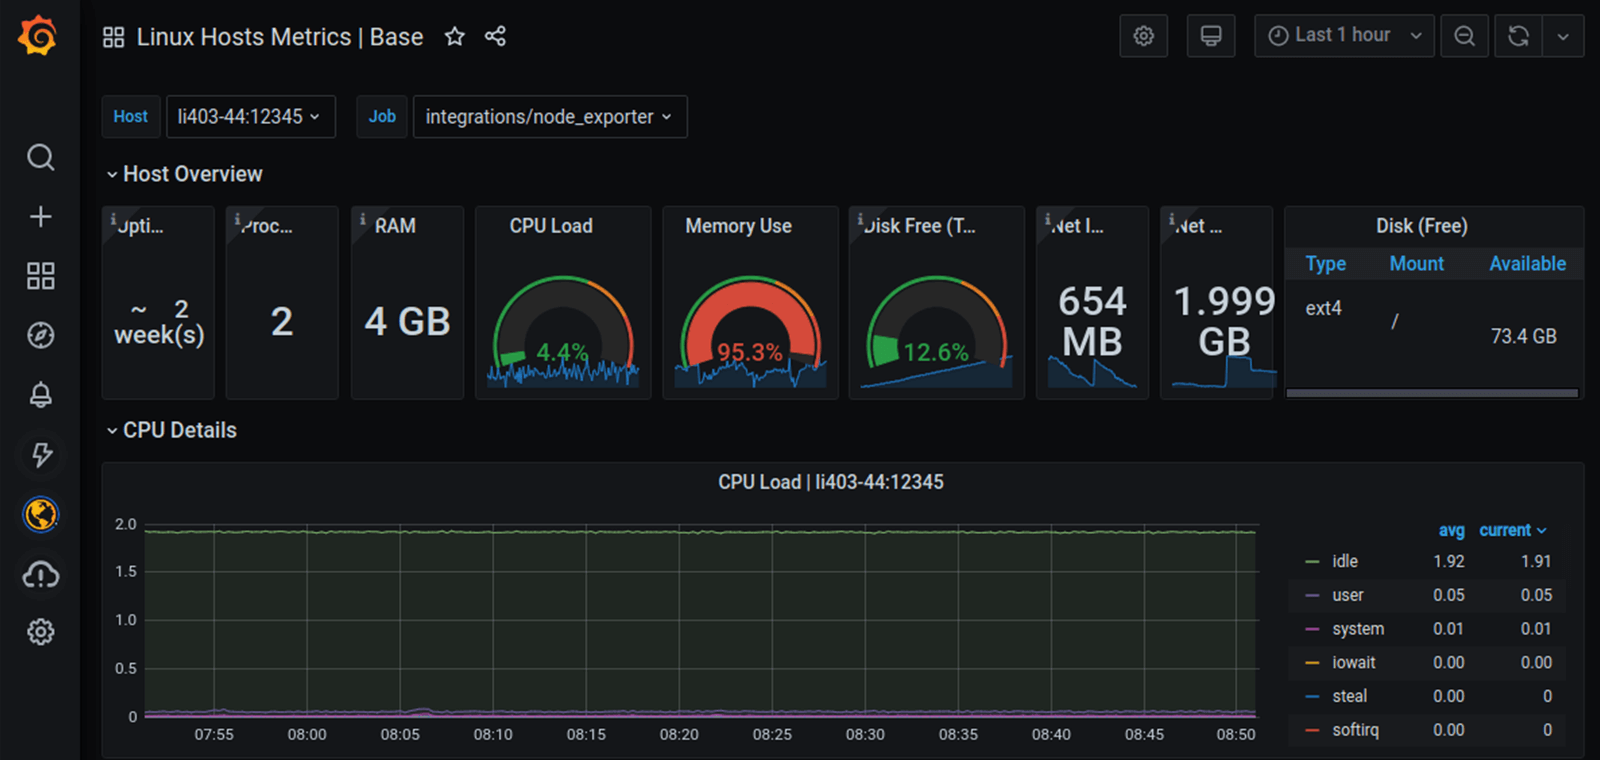
Metrics
Bring together the raw, unsampled metrics for all your applications and infrastructure, spread around the globe, in one place. Query high-cardinality data with blazing fast PromQL and Graphite queries. Centralize the analysis, visualization, and alerting on all of your metrics.
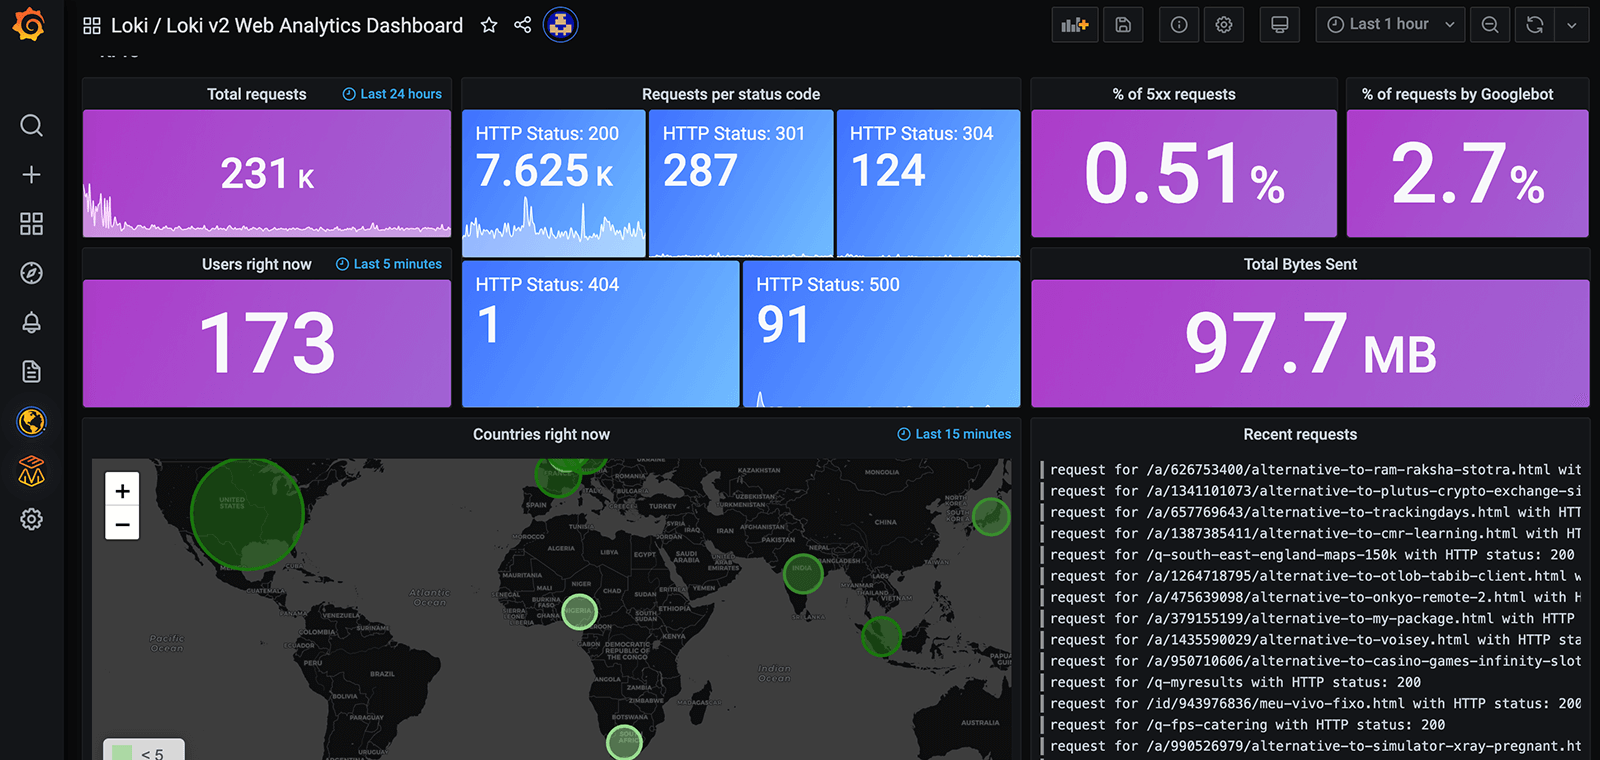
Logs
Grafana’s log aggregation and storage system allows you to bring together logs from all your applications and infrastructure in a single place. Easily export logs using Grafana Loki, Promtail, Fluentd, Fluentbit, Logstash, and more.
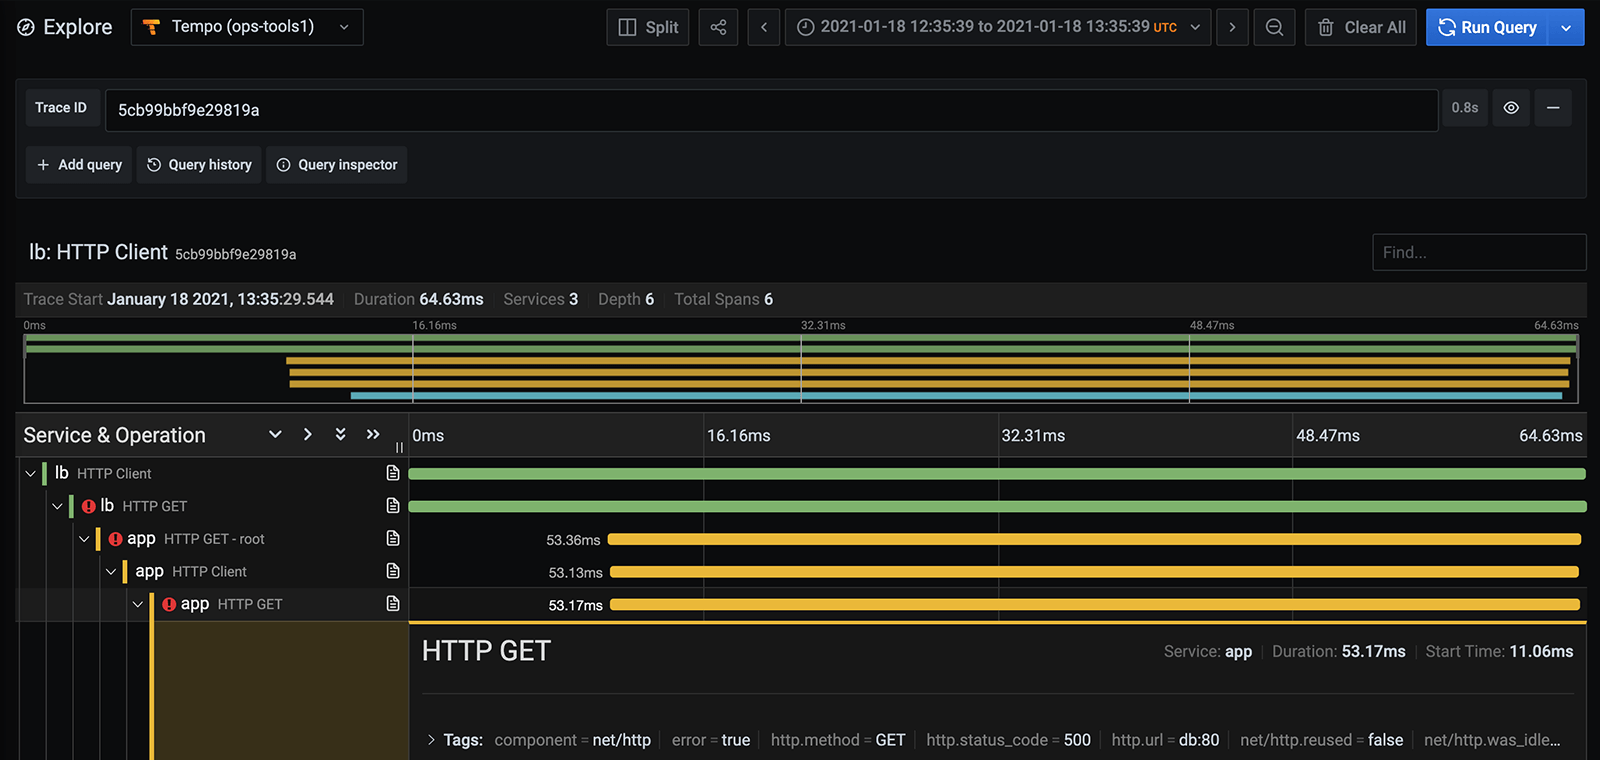
Traces
An easy-to-use, highly scalable, and cost-efficient distributed tracing backend that requires only object storage to operate. Compatible with any open source tracing protocols, including Jaeger, Zipkin, and OpenTelemetry.
Bring your own data
Send your local data to Grafana’s backend for long-term storage, aggregation, and high-performance querying. Forward your metrics, logs, and traces using existing services deployed into your environment.
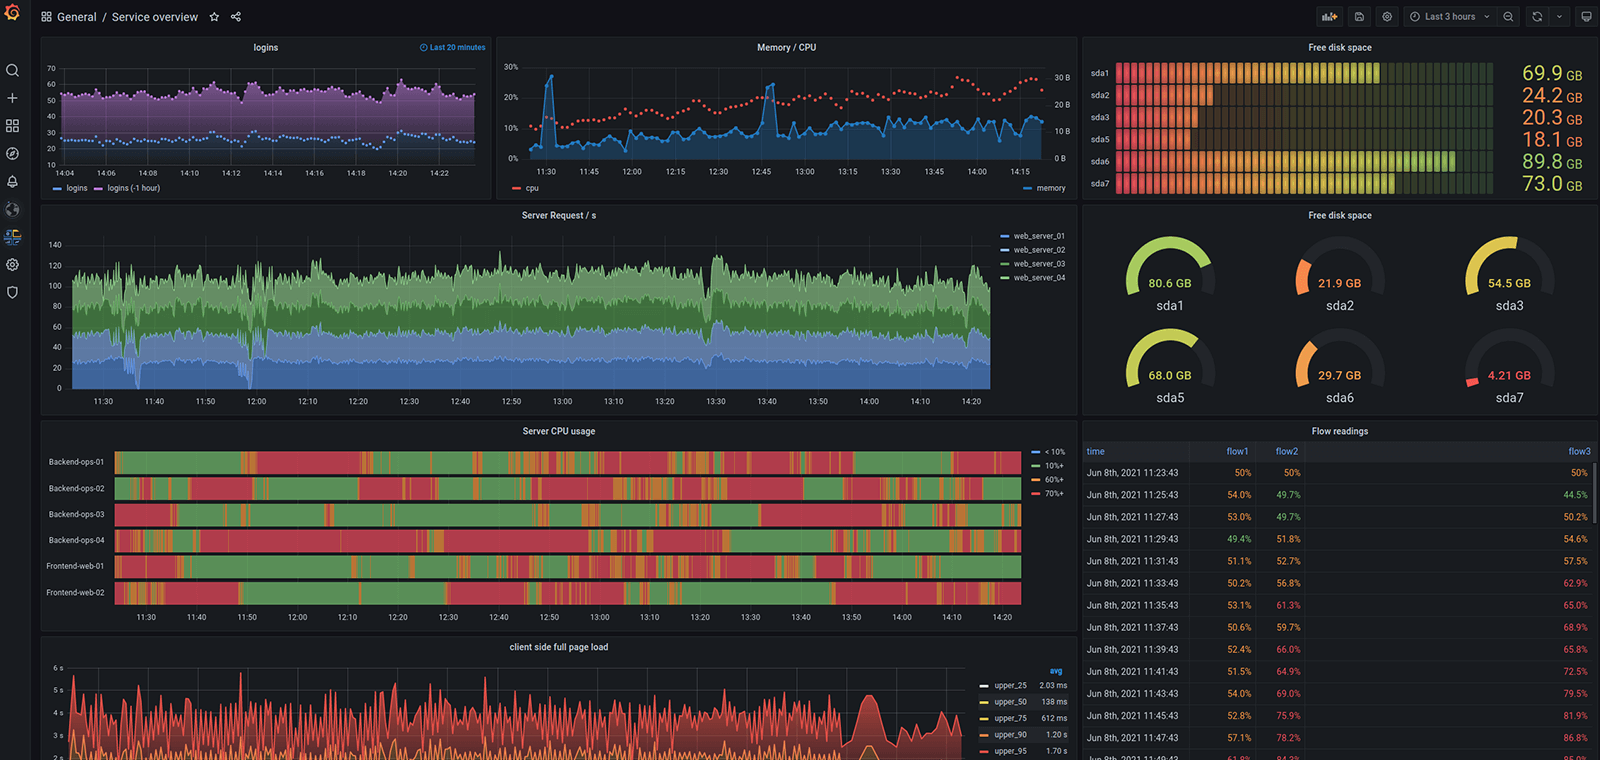
Dashboards
Create dynamic and reusable dashboards with a multitude of options that allow you to visualize your data any way you want.
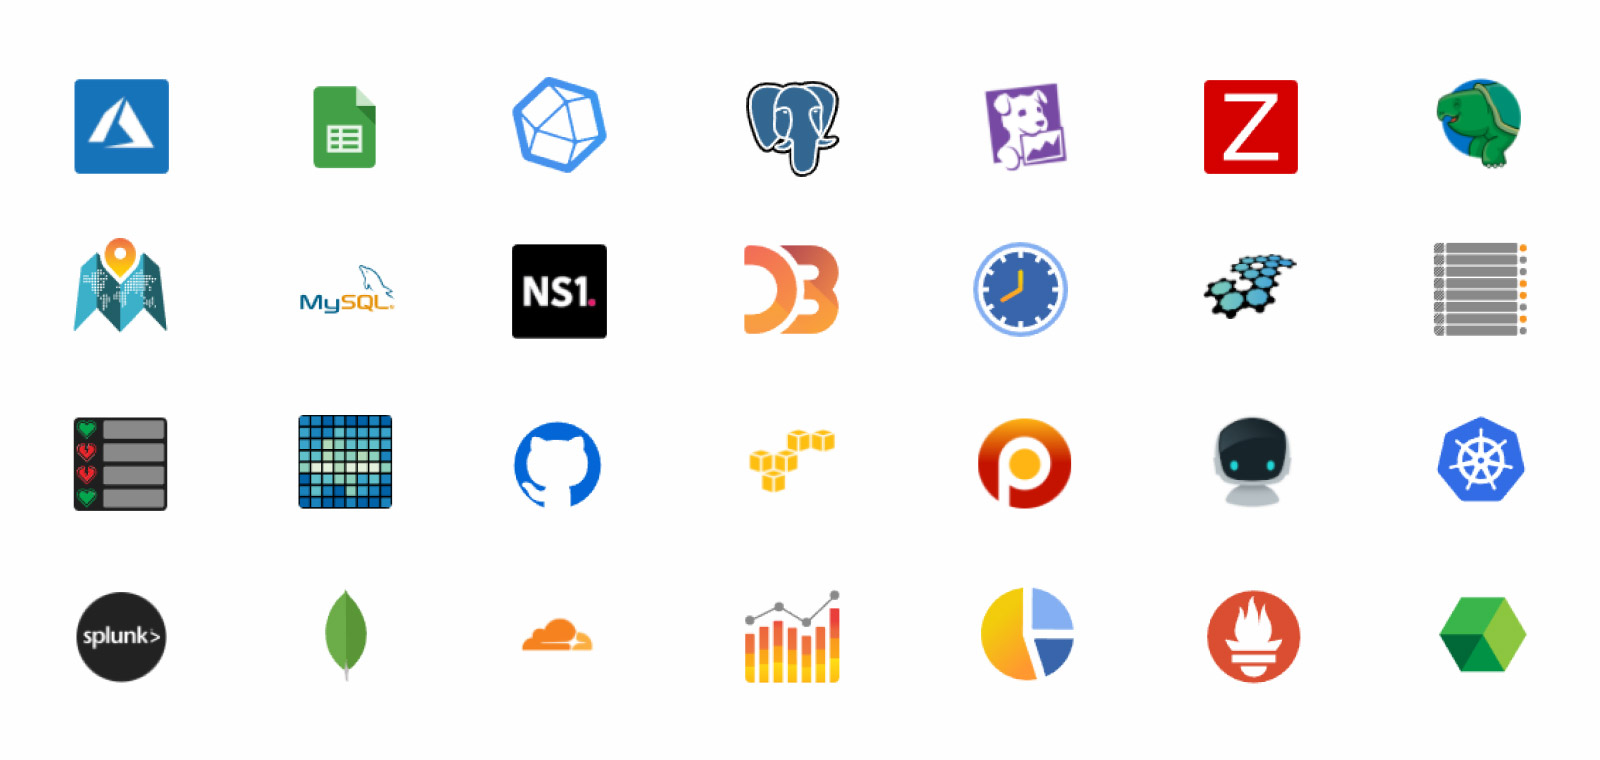
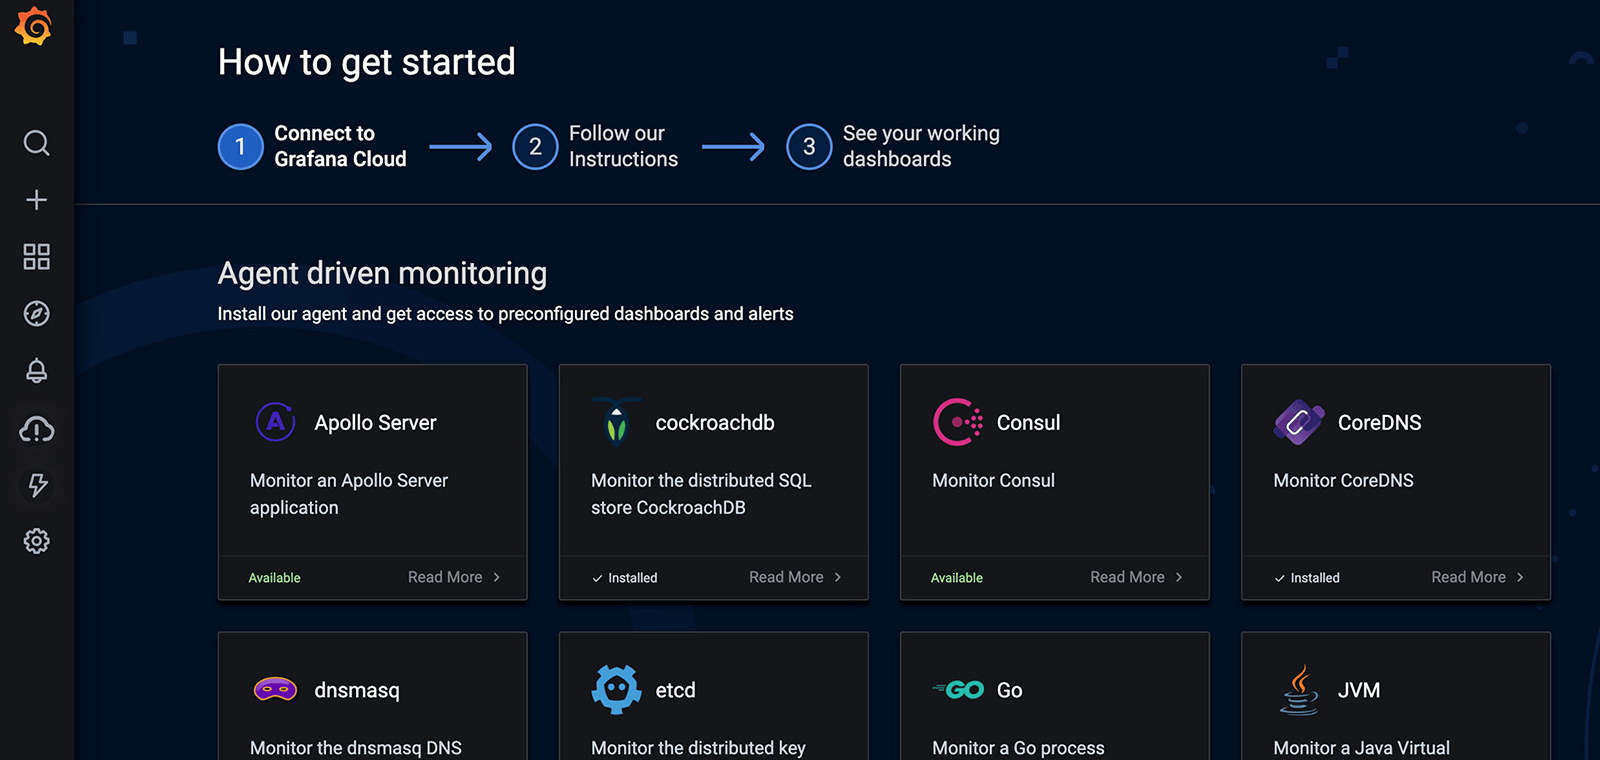
Plugins
Connect your tools and your teams with Grafana plugins. Data source plugins hook into existing data sources via APIs and render the data in real time without requiring you to migrate or ingest your data.
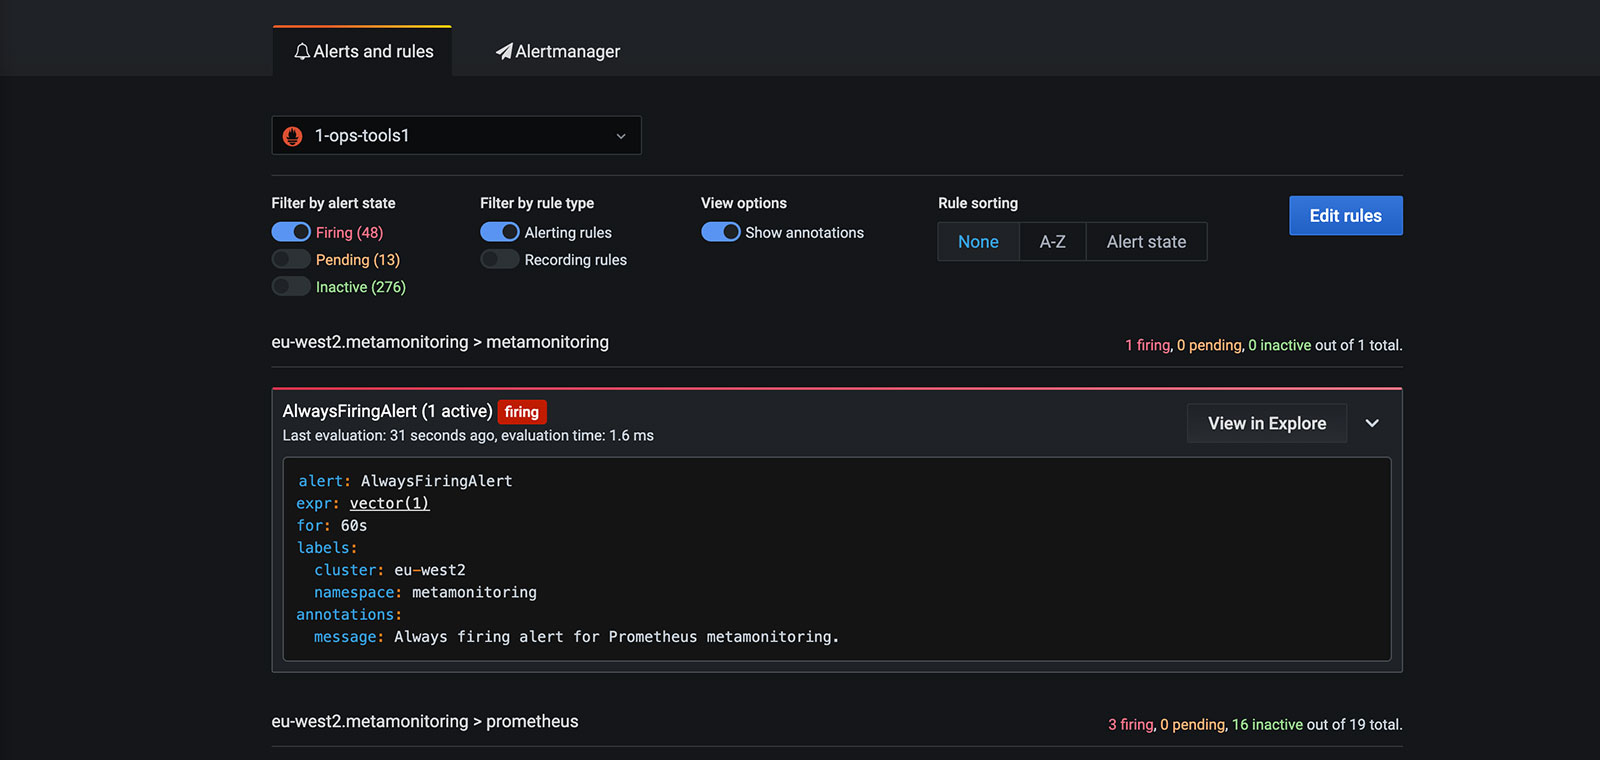
Alerts
With Grafana alerting, you can create, manage, and silence all of your alerts within one simple UI — allowing you to easily consolidate and centralize all of your alerts.
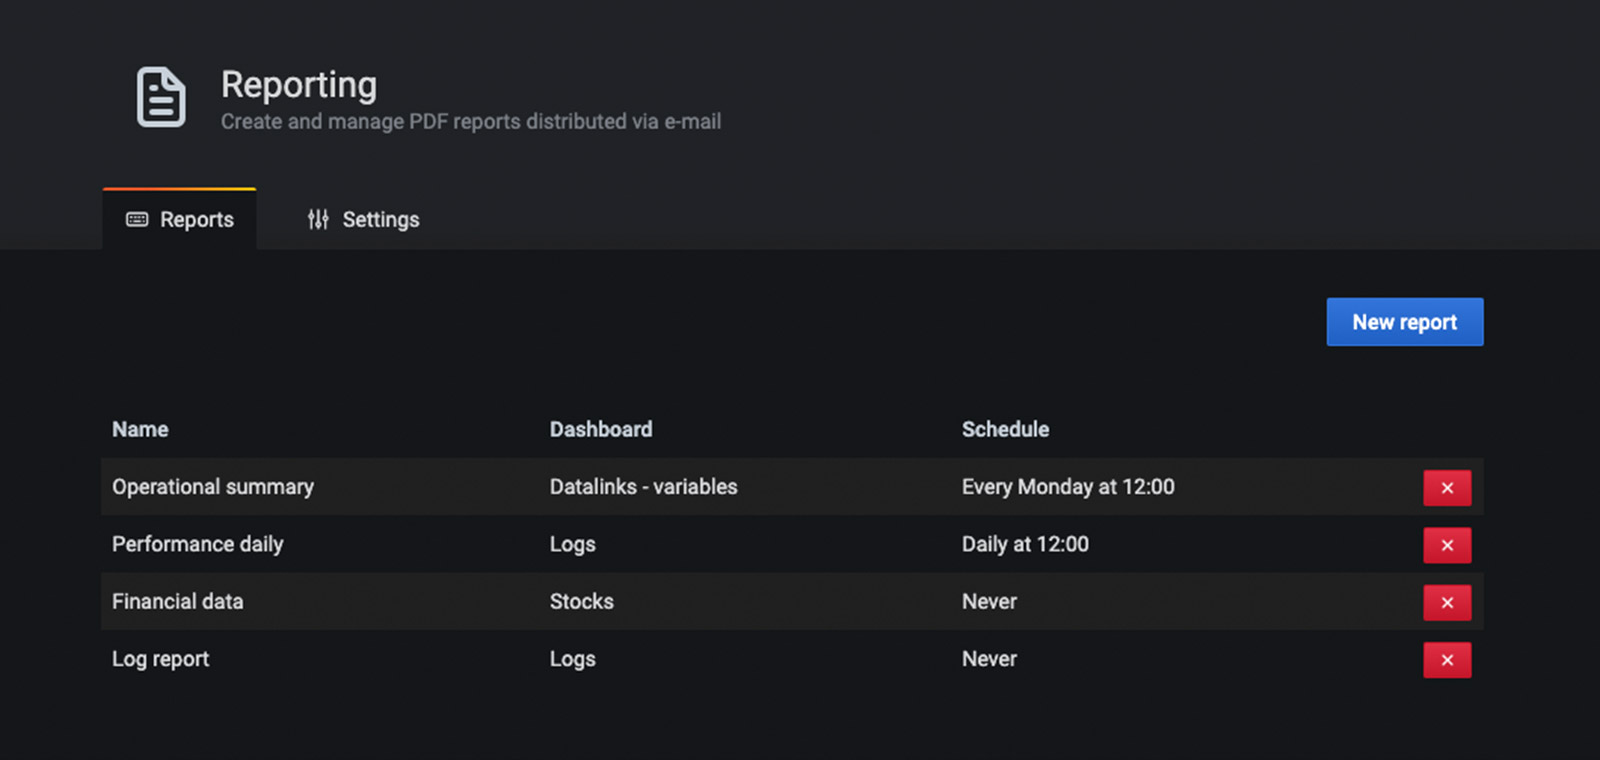
Reports
Automatically generate PDFs from any dashboards and have it emailed to interested parties on a schedule.
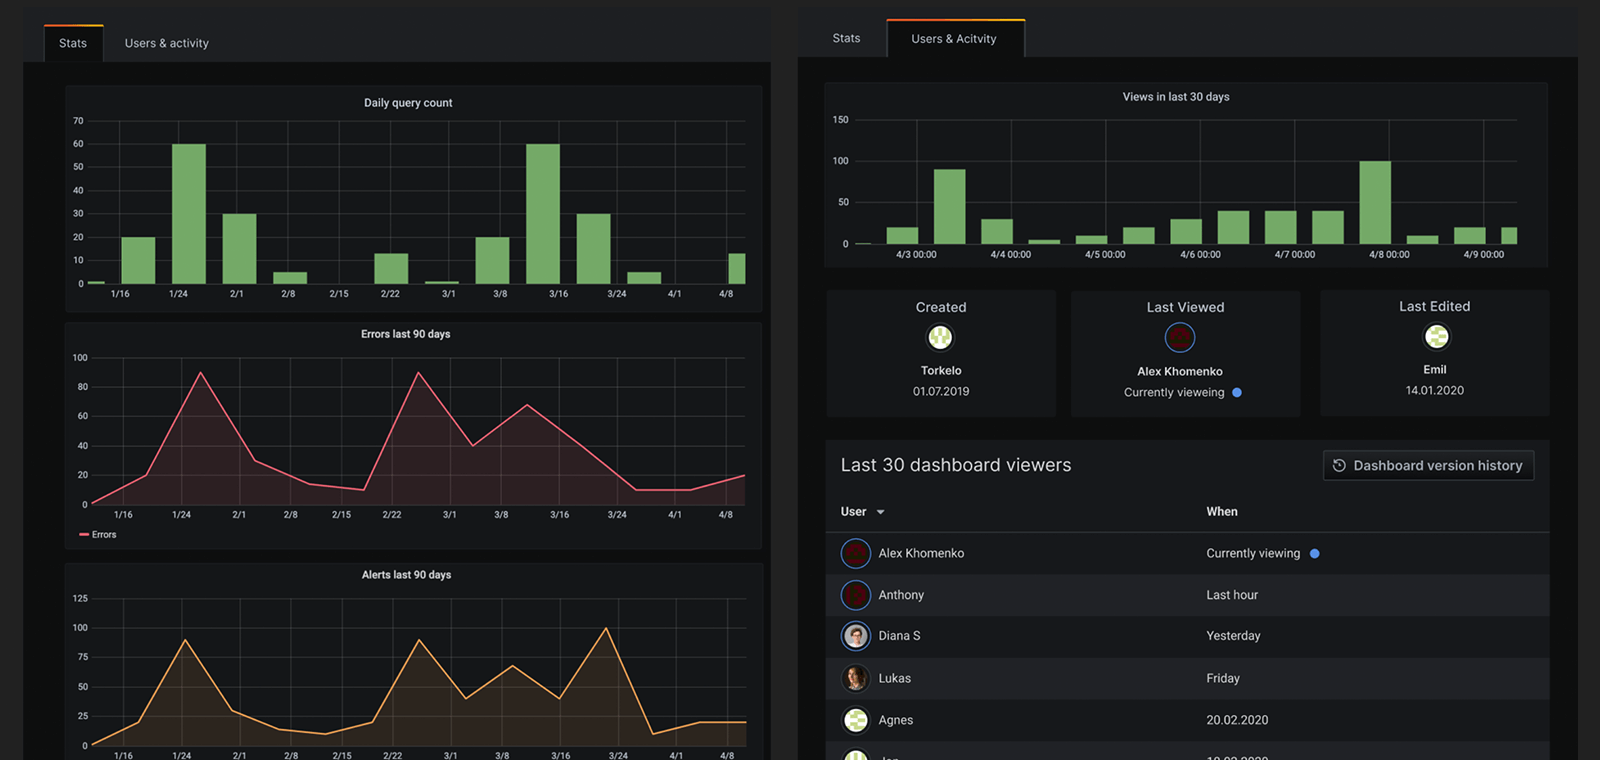
Usage insights
Bring everyone together, and share data and dashboards across teams. Grafana empowers users and helps foster a data-driven culture.
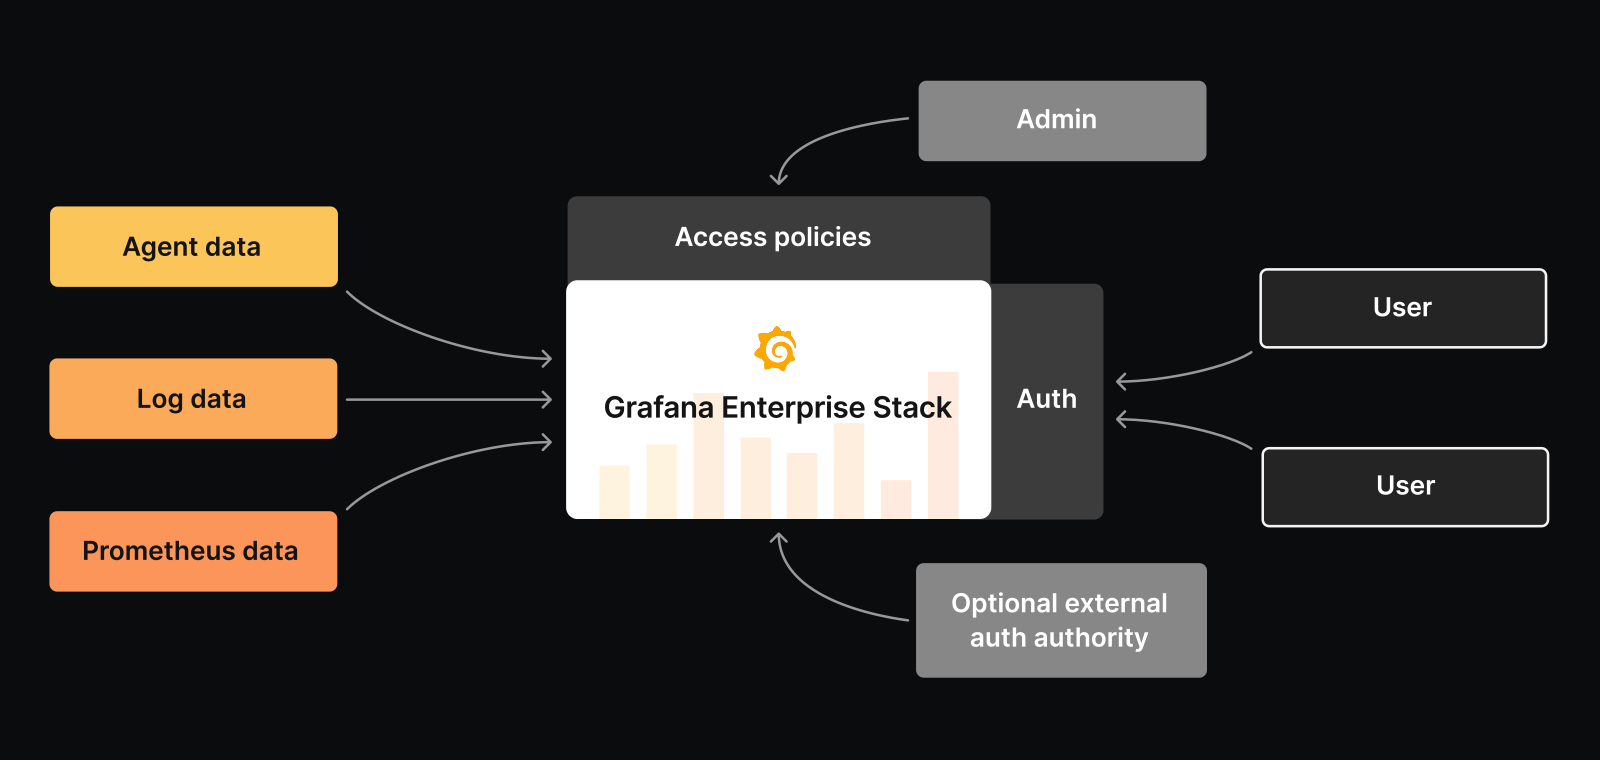
Governance
Confidently democratize data across your entire company with advanced admin tools to govern, audit, and secure user permissions and data.
Grafana
Grafana allows you to query, visualize, alert on, and understand your metrics no matter where they are stored. Create, explore, and share beautiful dashboards with your team and foster a data-driven culture.
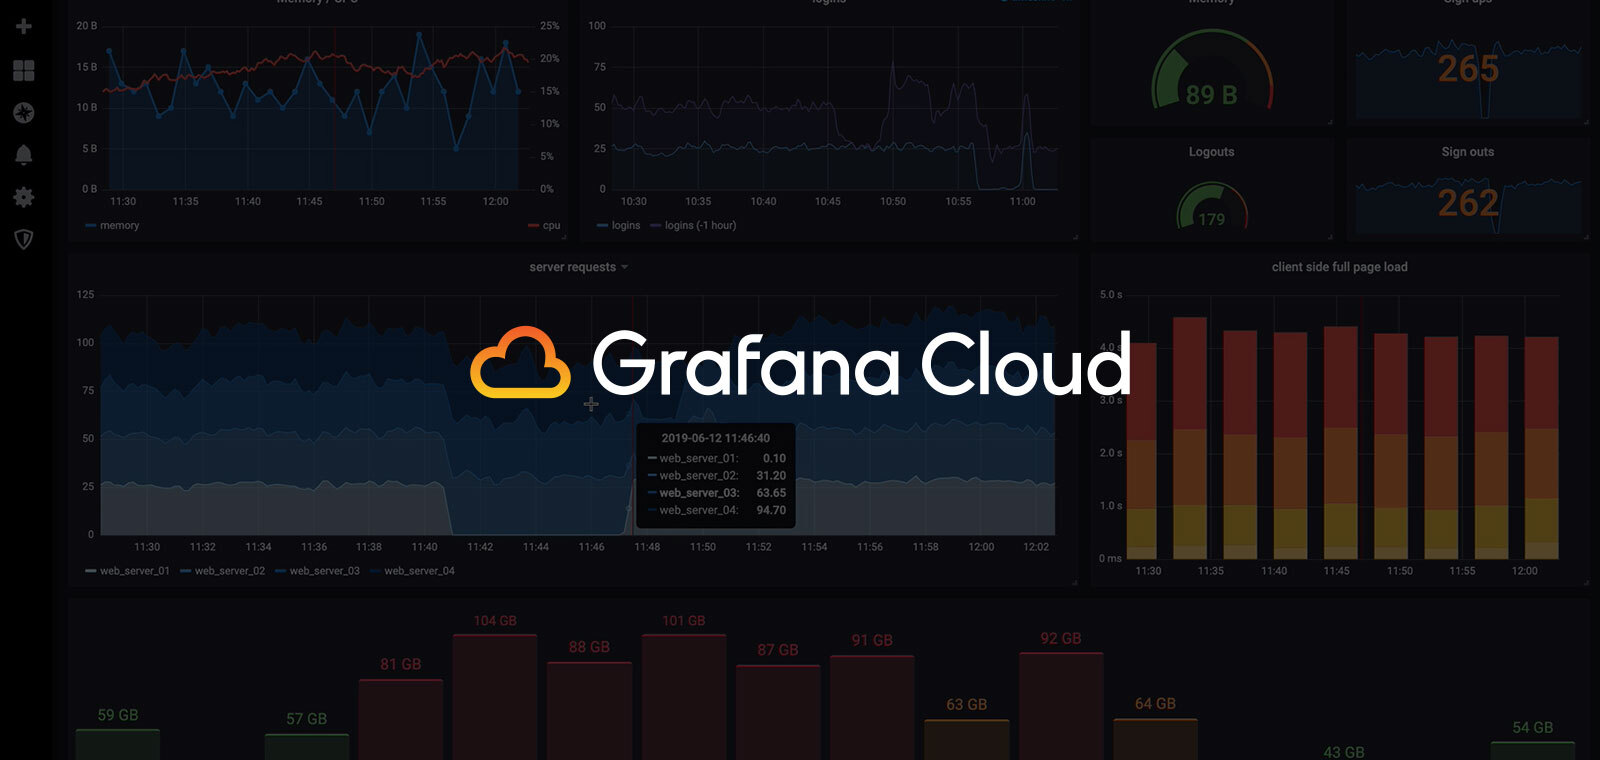
Grafana Cloud
Metrics, logs, and traces integrated within Grafana and run on the cloud.
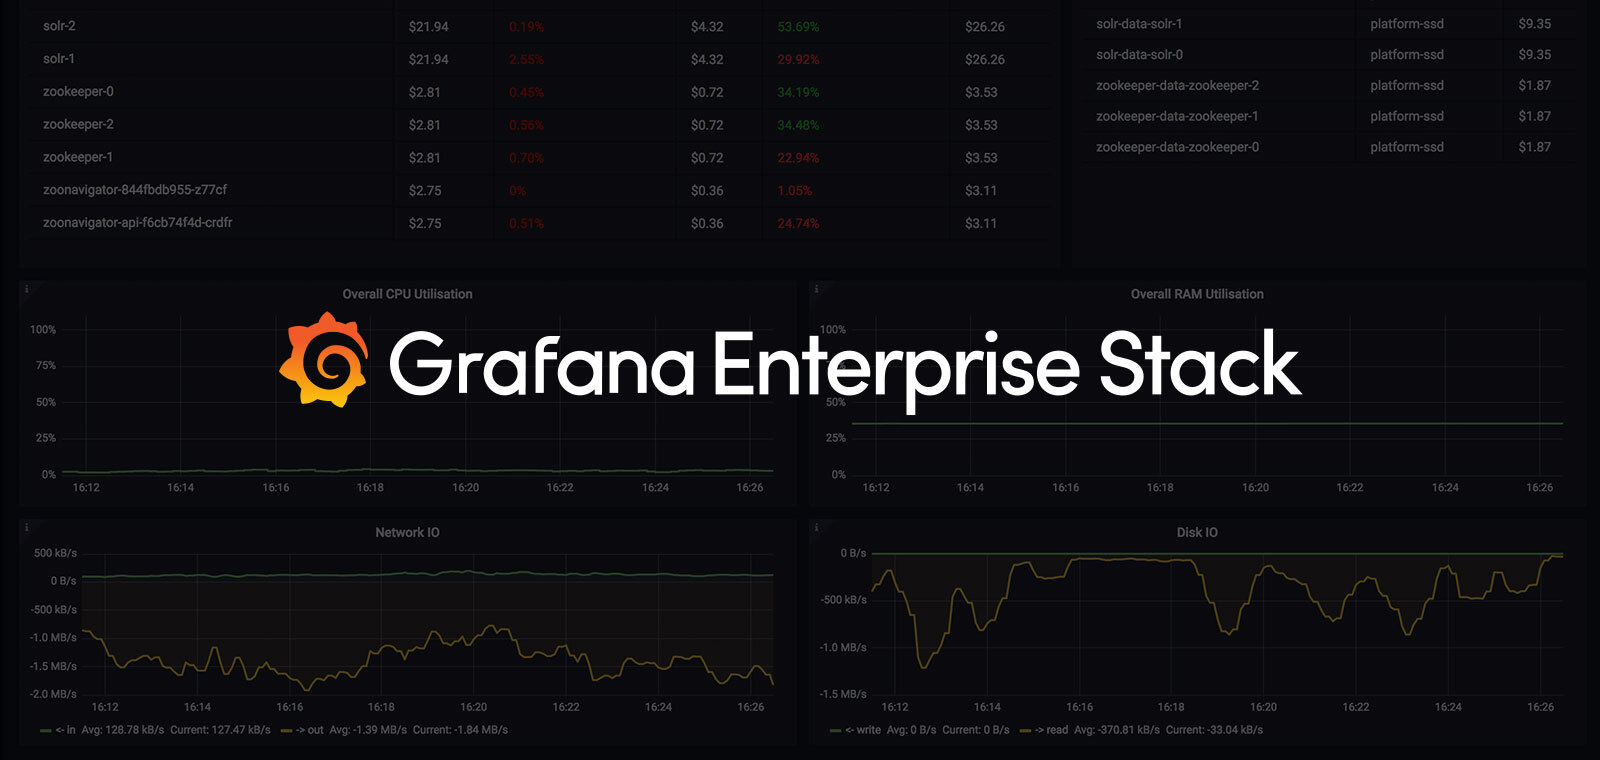
Self-managed
The best way to scale and secure metrics, logs and Grafana on your own infrastructure.