
Kubernetes cluster monitoring (via Prometheus)
Monitors Kubernetes cluster using Prometheus. Shows overall cluster CPU / Memory / Filesystem usage as well as individual pod, containers, systemd services statistics. Uses cAdvisor metrics only.
Full K8 solution with dashboards, alerts and KPIs available in Grafana Cloud free tier (with 10K free Prometheus series metrics and more): https://grafana.com/signup/cloud/connect-account

![]()
![]()
![]()
![]()
![]()
Initial idea was taken from this dashboard
and improved to exclude node-exporter dependency and to give more information
about cluster state.
Requirements
You only need to have running Kubernetes cluster with deployed Prometheus. Prometheus will use metrics provided by cAdvisor via kubelet service (runs on each node of Kubernetes cluster by default) and via kube-apiserver service only.
Your Prometheus configuration has to contain following
scrape_configs:
scrape_configs:
  - job_name: kubernetes-nodes-cadvisor
    scrape_interval: 10s
    scrape_timeout: 10s
    scheme: https  # remove if you want to scrape metrics on insecure port
    tls_config:
      ca_file: /var/run/secrets/kubernetes.io/serviceaccount/ca.crt
    bearer_token_file: /var/run/secrets/kubernetes.io/serviceaccount/token
    kubernetes_sd_configs:
      - role: node
    relabel_configs:
      - action: labelmap
        regex: __meta_kubernetes_node_label_(.+)
      # Only for Kubernetes ^1.7.3.
      # See: https://github.com/prometheus/prometheus/issues/2916
      - target_label: __address__
        replacement: kubernetes.default.svc:443
      - source_labels: [__meta_kubernetes_node_name]
        regex: (.+)
        target_label: __metrics_path__
        replacement: /api/v1/nodes/${1}/proxy/metrics/cadvisor
    metric_relabel_configs:
      - action: replace
        source_labels: [id]
        regex: '^/machine\.slice/machine-rkt\\x2d([^\\]+)\\.+/([^/]+)\.service$'
        target_label: rkt_container_name
        replacement: '${2}-${1}'
      - action: replace
        source_labels: [id]
        regex: '^/system\.slice/(.+)\.service$'
        target_label: systemd_service_name
        replacement: '${1}'
Features
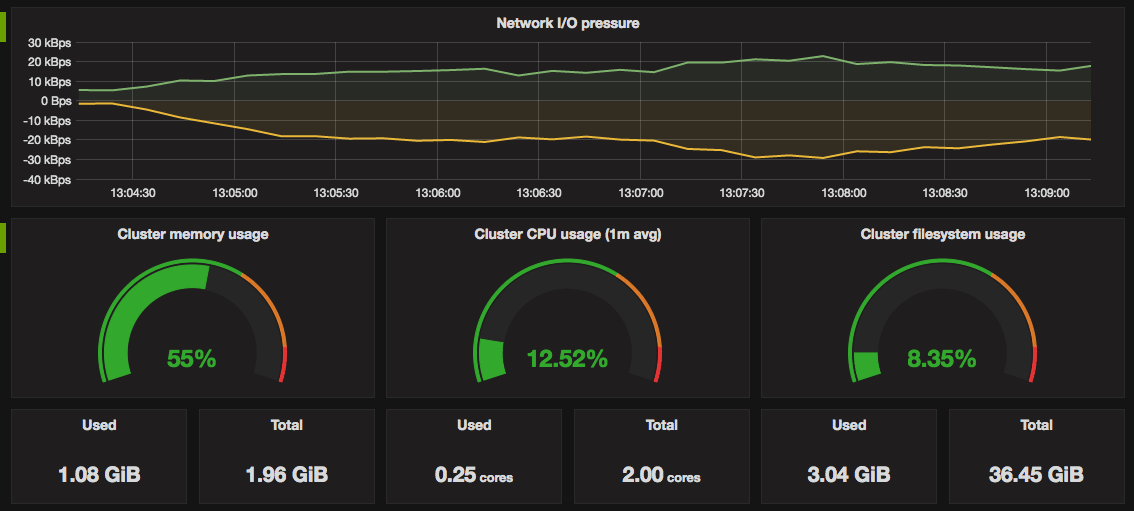
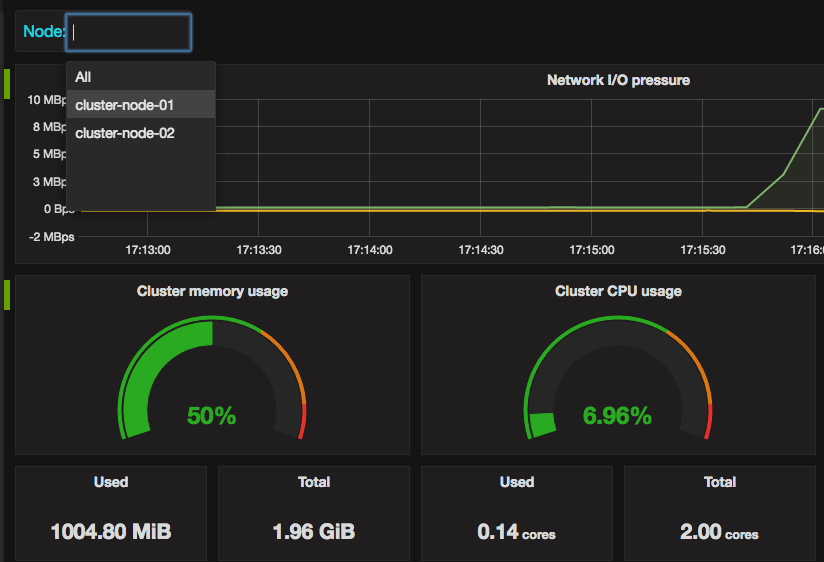
- Total and used cluster resources: CPU, memory, filesystem.
And total cluster network I/O pressure.![Total and used cluster resources]()
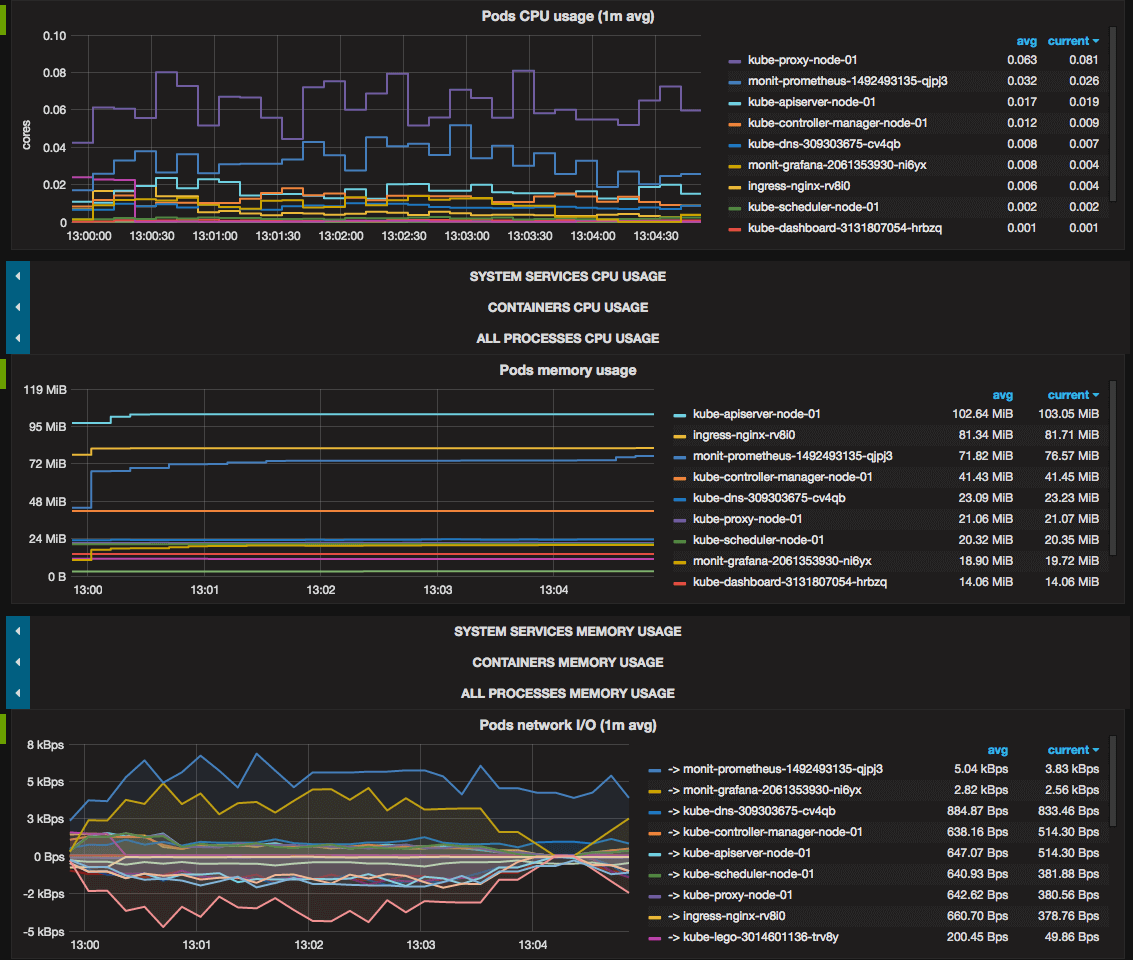
- Kubernetes pods usage:
CPU, memory, network I/O.
![Pods usage]()
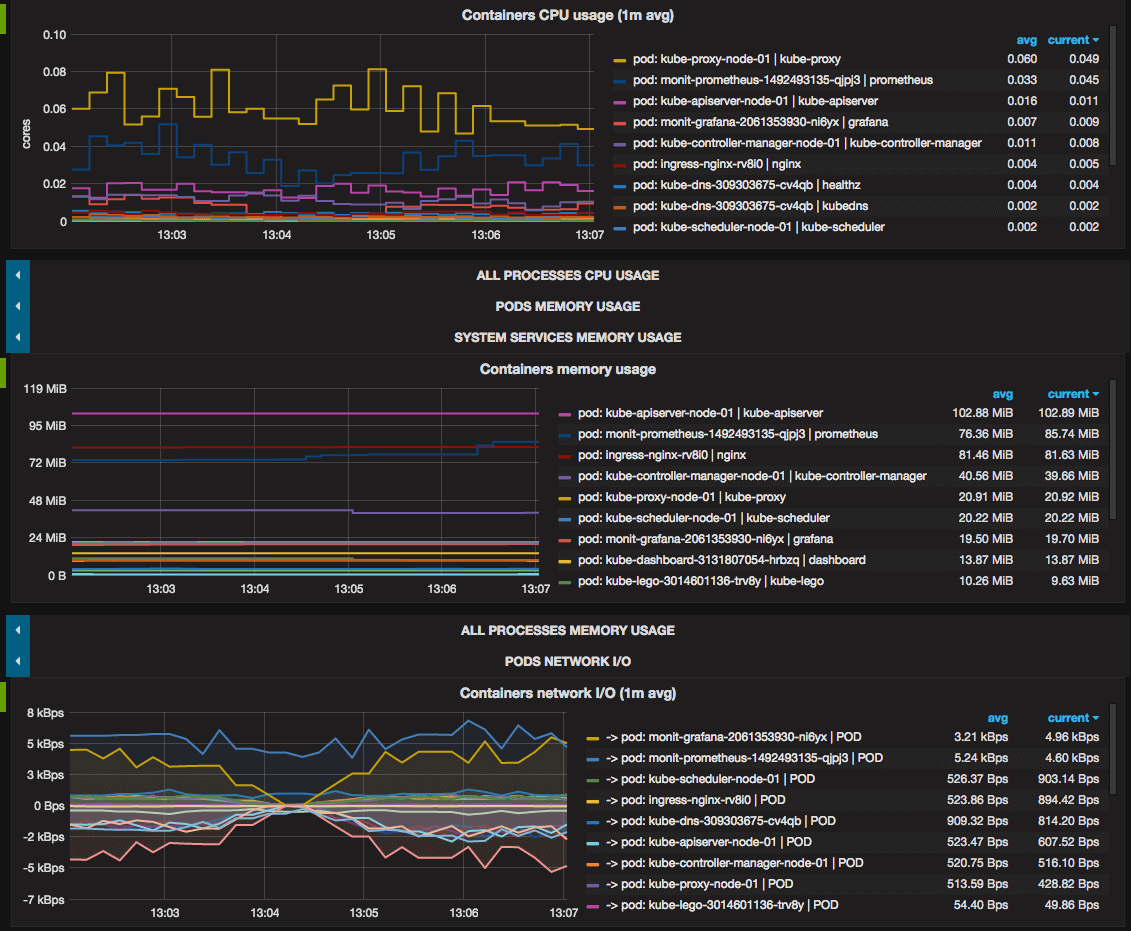
- Containers usage: CPU, memory, network I/O.
Docker and rkt containers which runs on cluster nodes but outside Kubernetes are also monitored.![Containers usage]()
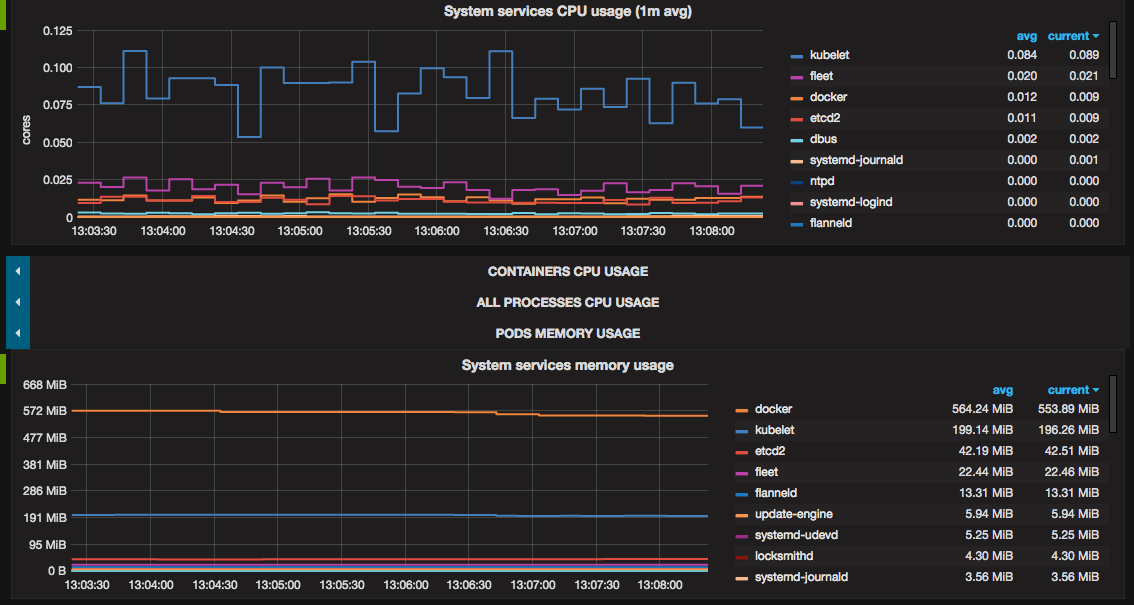
- systemd system services
usage: CPU, memory.
![systemd usage]()
- Showing all above metrics both for all cluster and each node separately.
![Filtering metrics by nodes]()
Troubleshooting
If filesystem usage panels display N/A, you should correct
device=~"^/dev/[vs]da9$" filter parameter in metrics query with devices your
system actually has.
Data source config
Collector config:
Upload an updated version of an exported dashboard.json file from Grafana
| Revision | Description | Created | |
|---|---|---|---|
| Download |
Kubernetes
Monitor your Kubernetes deployment with prebuilt dashboards that allow you to drill down from a high-level cluster overview to pod-specific details in minutes.
Learn more