Get started with Grafana Alerting - Part 2
Get started with Grafana Alerting - Part 2
The Get started with Grafana Alerting tutorial Part 2 is a continuation of Get started with Grafana Alerting tutorial Part 1.
In this guide, we dig into more complex yet equally fundamental elements of Grafana Alerting: alert instances and notification policies.
After introducing each component, you will learn how to:
- Configure an alert rule that returns more than one alert instance
- Create notification policies that route firing alert instances to different contact points
- Use labels to match alert instances and notification policies
Learning about alert instances and notification policies is useful if you have more than one contact point in your organization, or if your alert rule returns a number of metrics that you want to handle separately by routing each alert instance to a specific contact point. The tutorial will introduce each concept, followed by how to apply both concepts in a real-world scenario.
Before you begin
There are different ways you can follow along with this tutorial.
Grafana Cloud
- As a Grafana Cloud user, you don’t have to install anything. Create your free account.
Continue to Alert instances.
Interactive learning environment
- Alternatively, you can try out this example in our interactive learning environment: Get started with Grafana Alerting - Part 2. It’s a fully configured environment with all the dependencies already installed.
Grafana OSS
If you opt to run a Grafana stack locally, ensure you have the following applications installed:
Docker Compose (included in Docker for Desktop for macOS and Windows)
Set up the Grafana stack (OSS users)
To demonstrate the observation of data using the Grafana stack, download and run the following files.
Clone the tutorial environment repository.
git clone https://github.com/grafana/tutorial-environment.gitChange to the directory where you cloned the repository:
cd tutorial-environmentRun the Grafana stack:
docker compose up -dThe first time you run
docker compose up -d, Docker downloads all the necessary resources for the tutorial. This might take a few minutes, depending on your internet connection.Note
If you already have Grafana, Loki, or Prometheus running on your system, you might see errors, because the Docker image is trying to use ports that your local installations are already using. If this is the case, stop the services, then run the command again.
Alert instances
An alert instance is an event that matches a metric returned by an alert rule query.
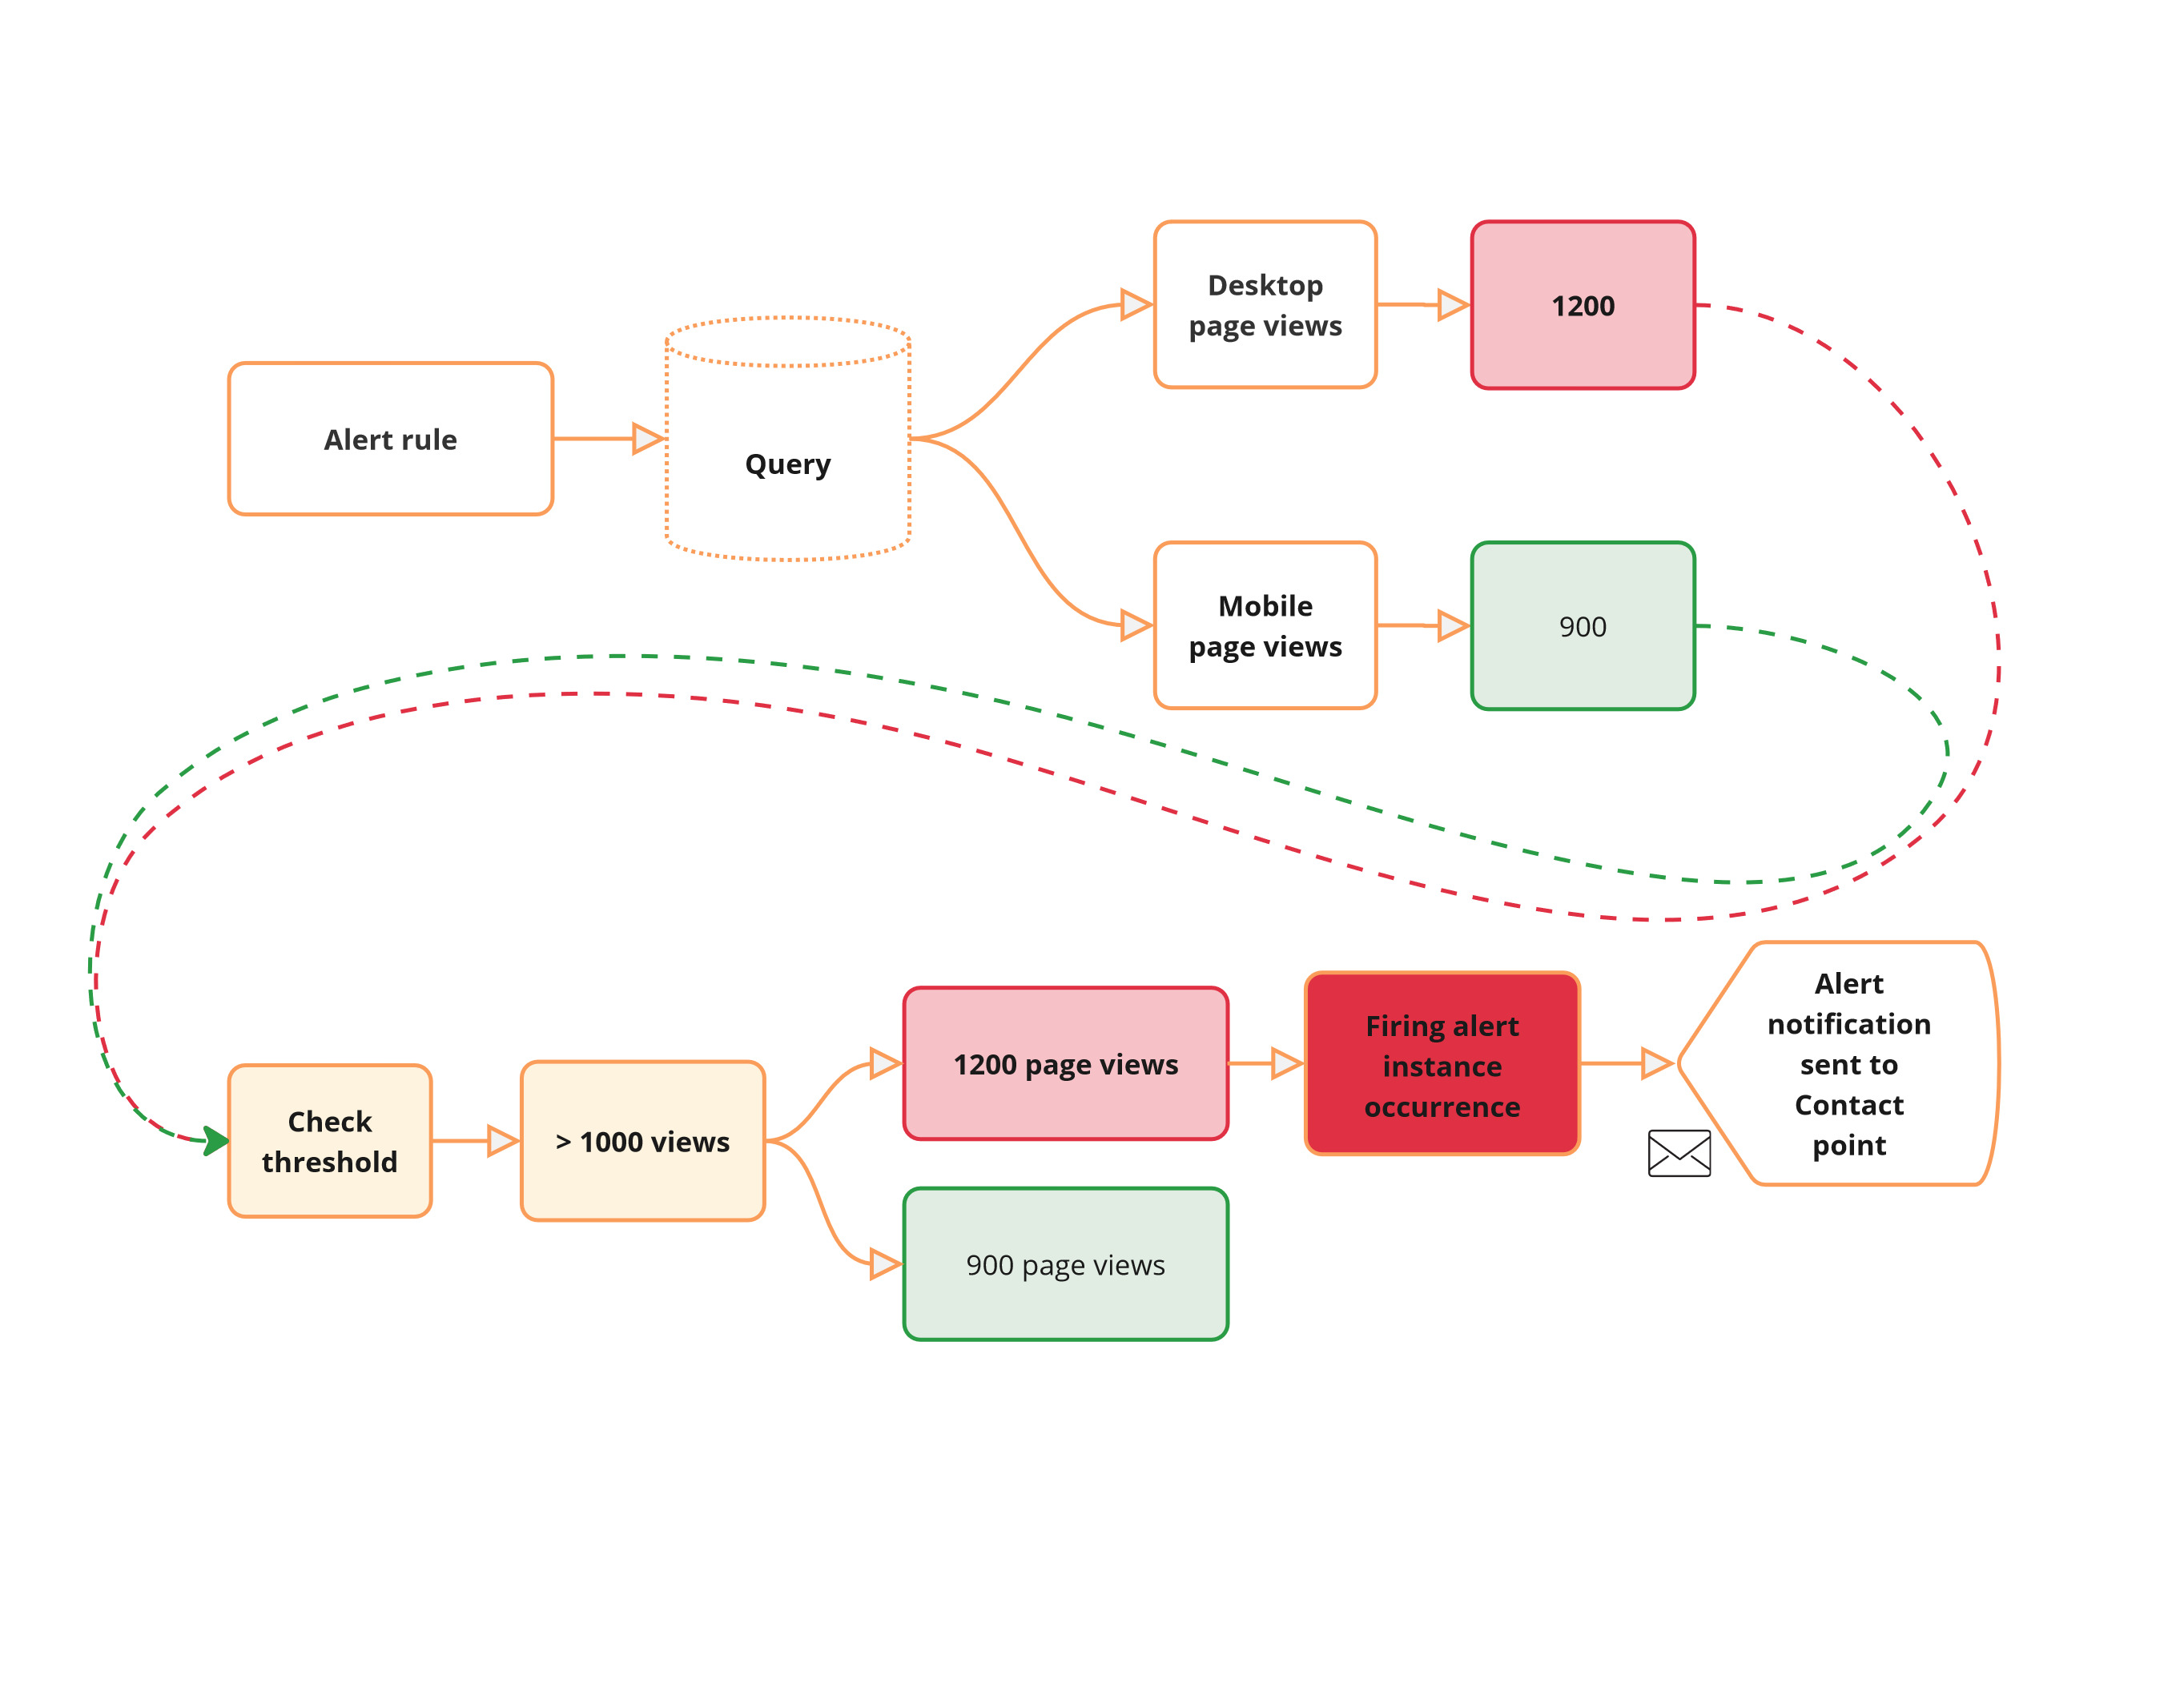
Let’s consider a scenario where you’re monitoring website traffic using Grafana. You’ve set up an alert rule to trigger an alert instance if the number of page views exceeds a certain threshold (more than 1000 page views) within a specific time period, say, over the past 5 minutes.
If the query returns more than one time-series, each time-series represents a different metric or aspect being monitored. In this case, the alert rule is applied individually to each time-series.

In this scenario, each time-series is evaluated independently against the alert rule. It results in the creation of an alert instance for each time-series. The time-series corresponding to the desktop page views meets the threshold and, therefore, results in an alert instance in Firing state for which an alert notification is sent. The mobile alert instance state remains Normal.
Notification policies
Notification policies route alerts to different communication channels, reducing alert noise and providing control over when and how alerts are sent. For example, you might use notification policies to ensure that critical alerts about server downtime are sent immediately to the on-call engineer. Another use case could be routing performance alerts to the development team for review and action.
Key Characteristics:
- Route alert notifications by matching alerts and policies with labels
- Manage when to send notifications

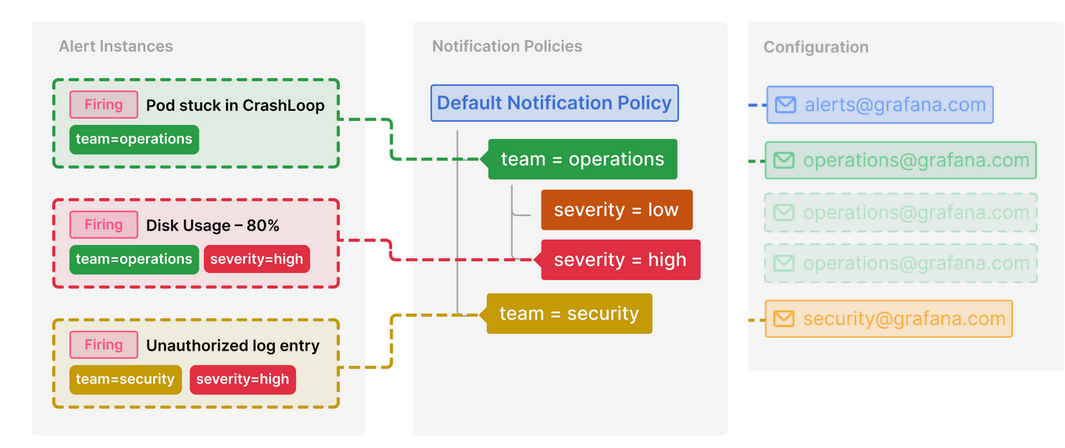
In the above diagram, alert instances and notification policies are matched by labels. For instance, the label team=operations matches the alert instance “Pod stuck in CrashLoop” and “Disk Usage -80%” to child policies that send alert notifications to a particular contact point (
operations@grafana.com).
Create notification policies
Create a notification policy if you want to handle metrics returned by alert rules separately by routing each alert instance to a specific contact point.
In your browser, sign in to your Grafana Cloud account.
OSS and interactive learning environment users: To log in, navigate to http://localhost:3000, where Grafana should be running.
Navigate to Alerts & IRM > Alerting > Notification policies.
In the Default policy, click + New child policy.
In the field Label enter
device, and in the field Value enterdesktop.From the Contact point drop-down, choose Webhook.
Note
If you don’t have any contact points, add a Contact point.
Click Save Policy.
This new child policy routes alerts that match the label
device=desktopto the Webhook contact point.Repeat the steps above to create a second child policy to match another alert instance. For labels use:
device=mobile. Use the Webhook integration for the contact point. Alternatively, experiment by using a different Webhook endpoint or a different integration.
Create an alert rule that returns alert instances
The alert rule that you are about to create is meant to monitor web traffic page views. The objective is to explore what an alert instance is and how to leverage routing individual alert instances by using label matchers and notification policies.
Create an alert rule
- Navigate to Alerts & IRM > Alerting > Alert rules.
- Click New alert rule.
Enter an alert rule name
Make it short and descriptive as this will appear in your alert notification. For instance, web-traffic.
Define query and alert condition
In this section, we use the default options for Grafana-managed alert rule creation. The default options let us define the query, a expression (used to manipulate the data – the WHEN field in the UI), and the condition that must be met for the alert to be triggered (in default mode is the threshold).
Grafana includes a test data source that creates simulated time series data. This data source is included in the demo environment for this tutorial. If you’re working in Grafana Cloud or your own local Grafana instance, you can add the data source through the Connections menu.
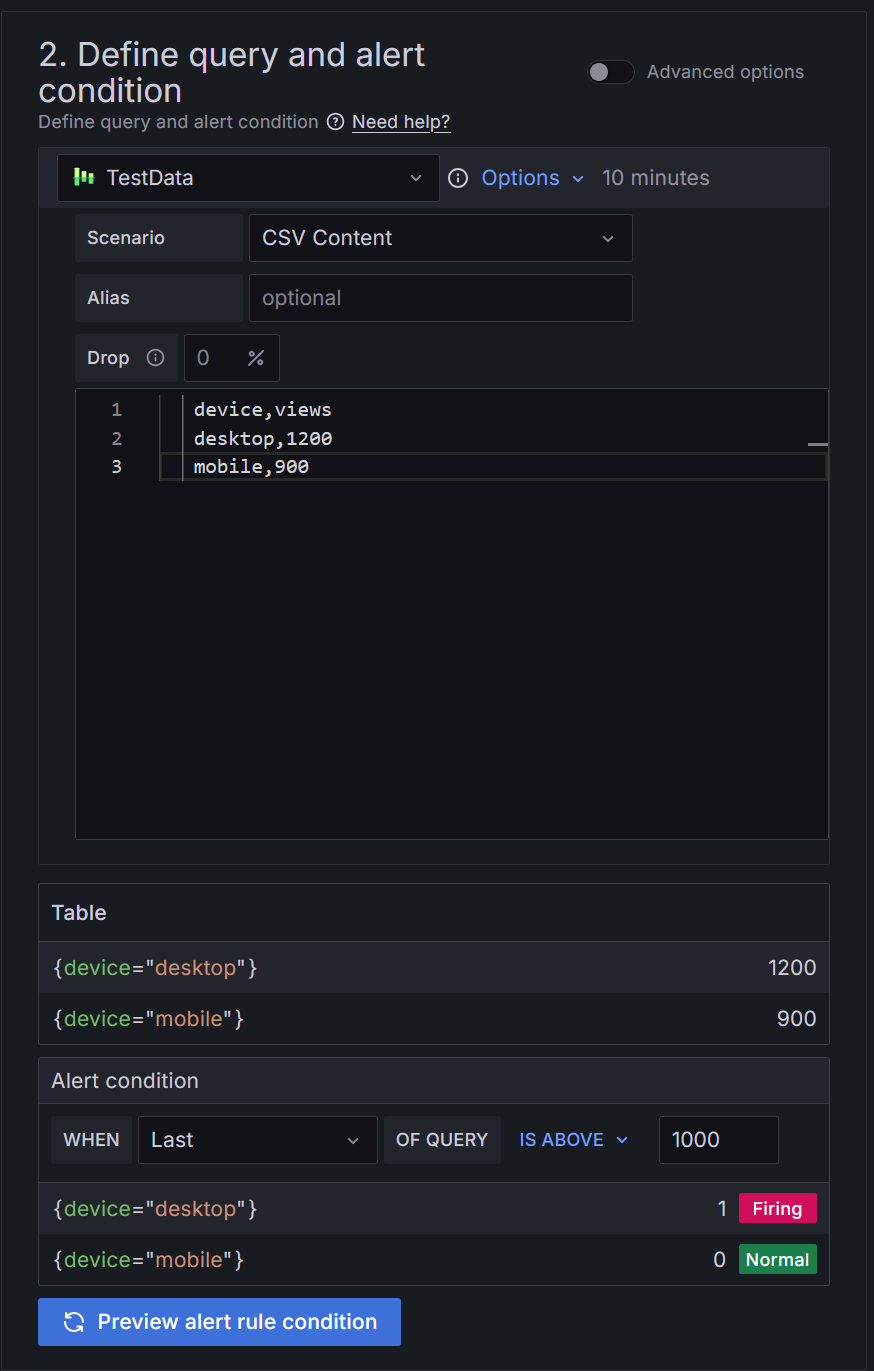
Select TestData data source from the drop-down menu.
From Scenario select CSV Content.
Copy in the following CSV data:
device,views
desktop,1200
mobile,900
The above CSV data simulates a data source returning multiple time series, each leading to the creation of an alert instance for that specific time series. Note that the data returned matches the example in the Alert instance section.
In the Alert condition section:
- Keep
Lastas the value for the reducer function (WHEN), and1000as the threshold value. This is the value above which the alert rule should trigger.
- Keep
Click Preview alert rule condition to run the queries.
It should return two series.desktop in Firing state, and mobile in Normal state. The values 1, and 0 mean that the condition is either true or false.

Add folders and labels
- In Folder, click + New folder and enter a name. For example:
web-traffic-alerts. This folder contains our alert rules.
Set evaluation behavior
In the life cycle of alert instances, when an alert condition (threshold) is not met, the alert instance state is Normal. Similarly, when the condition is breached (for longer than the pending period, which in this tutorial will be 0), the alert instance state switches back to Alerting, which means that the alert rule state is Firing, and a notification is sent.
To set up evaluation behavior:
- In Evaluation group and interval, repeat the above step to create a new evaluation group. Name it
1m(referring to “1 minute”). - Choose an Evaluation interval (how often the alert will be evaluated). Choose
1m. - Set the pending period to
0s(zero seconds), so the alert rule fires the moment the condition is met.
Configure notifications
In this section, you can select how you want to route your alert instances. Since we want to route by notification policy, we need to ensure that the labels match the alert instance.
Choose Use notification policy.
Click Preview routing. Based on the existing labels, you should see a preview of what policies are matching with the alerts. There should be two alert instances matching the labels that were previously setup in each notification policy:
device=desktop,device=mobile.These types of labels are generated by the data source query and they can be leveraged to match our notification policies without needing to manually add them to the alert rule.
![Routing preview of matched notification policies Screenshot showing a routing preview of matched notification policies, detailing how alerts are matched and routed to specific notification channels]()
Routing preview of matched notification policies Note
Even if both labels match the policies, only the alert instance in Firing state produces an alert notification.
Click Save rule and exit.
Now that we have set up the alert rule, it’s time to check the alert notification.
Receive alert notifications
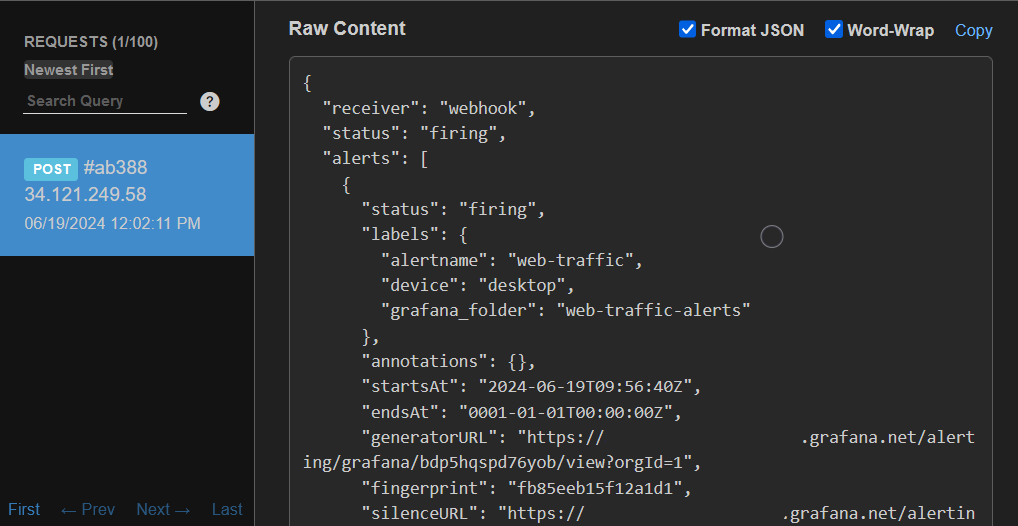
Now that the alert rule has been configured, you should receive alert notifications in the contact point whenever the alert triggers and gets resolved. In our example, each alert instance should be routed separately as we configured labels to match notification policies. Once the evaluation interval has concluded (1m), you should receive an alert notification in the Webhook endpoint.

The alert notification details show that the alert instance corresponding to the website views from desktop devices was correctly routed through the notification policy to the Webhook contact point. The notification also shows that the instance is in Firing state, as well as it includes the label device=desktop, which makes the routing of the alert instance possible.
Feel free to change the CSV data in the alert rule to trigger the routing of the alert instance that matches the label device=mobile.
Summary
In this tutorial, you have learned how Grafana Alerting can route individual alert instances using the labels generated by the data-source query and match these labels with notification policies, which in turn routes alert notifications to specific contact points.
If you run into any problems, you are welcome to post questions in our Grafana Community forum.
Learn more in Grafana Alerting Part 3
Tip
In Get started with Grafana Alerting - Part 3 you learn how to group alert notifications effectively.


