Get started with Grafana Alerting - Create and receive your first alert
In this tutorial, we walk you through the process of setting up your first alert in just a few minutes. You’ll witness your alert in action with real-time data, as well as sending alert notifications.

In this tutorial you will:
- Create a contact point.
- Set up an alert rule.
- Receive firing and resolved alert notifications in a public webhook.
Tip
After you have completed Part 1, don’t forget to explore the advanced but essential alerting topics in Multi-dimensional alerts and how to route them.
Before you begin
There are different ways you can follow along with this tutorial.
Grafana Cloud
- As a Grafana Cloud user, you don’t have to install anything. Create your free account.
Continue to Create a contact point.
Interactive learning environment
- Alternatively, you can try out this example in our interactive learning environment. It’s a fully configured environment with all the dependencies already installed.
Grafana OSS
If you opt to run a Grafana stack locally, ensure you have the following applications installed:
Docker Compose (included in Docker for Desktop for macOS and Windows)
Set up the Grafana stack (OSS users)
To demonstrate the observation of data using the Grafana stack, download and run the following files.
Clone the tutorial environment repository.
git clone https://github.com/grafana/tutorial-environment.gitChange to the directory where you cloned the repository:
cd tutorial-environmentRun the Grafana stack:
docker compose up -dThe first time you run
docker compose up -d, Docker downloads all the necessary resources for the tutorial. This might take a few minutes, depending on your internet connection.Note
If you already have Grafana, Loki, or Prometheus running on your system, you might see errors, because the Docker image is trying to use ports that your local installations are already using. If this is the case, stop the services, then run the command again.
Create a contact point
Besides being an open-source observability tool, Grafana has its own built-in alerting service. This means that you can receive notifications whenever there is an event of interest in your data, and even see these events graphed in your visualizations.
In this step, we set up a new contact point. This contact point uses the webhook integration. In order to make this work, we also need an endpoint for our webhook integration to receive the alert. We can use Webhook.site to quickly set up that test endpoint. This way we can make sure that our alert is actually sending a notification somewhere.
In your browser, sign in to your Grafana Cloud account.
OSS users: To log in, navigate to http://localhost:3000, where Grafana is running.
In another tab, go to Webhook.site.
Copy Your unique URL.
Your webhook endpoint is now waiting for the first request.
Next, let’s configure a contact point in Grafana’s Alerting UI to send notifications to our webhook endpoint.
Return to Grafana. In Grafana’s sidebar, hover over the Alerting (bell) icon and then click Contact points.
Click + Create contact point.
In Name, write Webhook.
In Integration, choose Webhook.
In URL, paste the endpoint to your webhook endpoint.
Click Test, and then click Send test notification to send a test alert to your webhook endpoint.
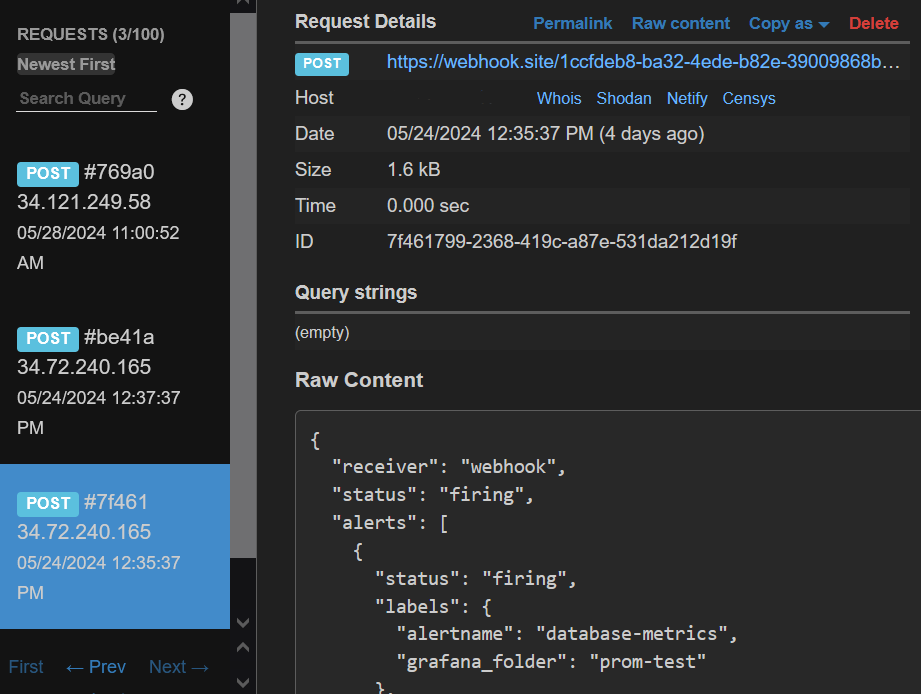
Navigate back to Webhook.site. On the left side, there’s now a
POST /entry. Click it to see what information Grafana sent.![A POST entry in Webhook.site A POST entry in Webhook.site]()
A POST entry in Webhook.site Return to Grafana and click Save contact point.
We have created a dummy Webhook endpoint and created a new Alerting contact point in Grafana. Now, we can create an alert rule and link it to this new integration.
Create an alert
Next, we establish an alert rule within Grafana Alerting to notify us whenever alert rules are triggered and resolved.
In Grafana, navigate to Alerts & IRM > Alerting > Alert rules. Click on + New alert rule.
Enter alert rule name for your alert rule. Make it short and descriptive as this appears in your alert notification. For instance, database-metrics
Define query and alert condition
In this section, we use the default options for Grafana-managed alert rule creation. The default options let us define the query, a expression (used to manipulate the data – the WHEN field in the UI), and the condition that must be met for the alert to be triggered (in default mode is the threshold).
Grafana includes a test data source that creates simulated time series data. This data source is included in the demo environment for this tutorial. If you’re working in Grafana Cloud or your own local Grafana instance, you can add the data source through the Connections menu.
Select the TestData data source from the drop-down menu.
In the Alert condition section:
- Keep Random Walk as the Scenario.
- Keep
Lastas the value for the reducer function (WHEN), andIS ABOVE 0as the threshold value. This is the value above which the alert rule should trigger.
Click Preview alert rule condition to run the query.
It should return random time series data. The alert rule state should be
Firing.![A preview of a firing alert A preview of a firing alert]()
A preview of a firing alert
Add folders and labels
- In Folder, click + New folder and enter a name. For example:
metric-alerts. This folder contains our alert rules.
Set evaluation behavior
The alert rule evaluation defines the conditions under which an alert rule triggers, based on the following settings:
- Evaluation group: every alert rule is assigned to an evaluation group. You can assign the alert rule to an existing evaluation group or create a new one.
- Evaluation interval: determines how frequently the alert rule is checked. For instance, the evaluation may occur every 10s, 30s, 1m, 10m, etc.
- Pending period: how long the condition must be met to trigger the alert rule.
- Keep firing for: defines how long an alert should remain in the Firing state after the alert condition stops being true. During this time, the alert enters a Recovering state, suppressing additional notifications but keeping the alert active. It helps prevent alert flapping, where alerts rapidly switch between firing and resolved due to noisy or unstable metrics.
To set up the evaluation:
- In the Evaluation group and interval, enter a name. For example:
1m-evaluation. - Choose an Evaluation interval (how often the alert are evaluated).
For example, every
1m(1 minute). - Set the pending period to,
0s(zero seconds), so the alert rule fires the moment the condition is met. - Set Keep firing for to,
0s, so the alert stops firing immediately after the condition is no longer true. Use this when you want alerts to be resolved as soon as the system is healthy again.
Configure notifications
Choose the contact point where you want to receive your alert notifications.
- Under Contact point, select Webhook from the drop-down menu.
- Click Save rule and exit at the top right corner.
Trigger and resolve an alert
Now that the alert rule has been configured, you should receive alert notifications in the contact point whenever alerts trigger and get resolved.
Trigger an alert
Since the alert rule that you have created has been configured to always fire, once the evaluation interval has concluded, you should receive an alert notification in the Webhook endpoint.

The alert notification details show that the alert rule state is Firing , and it includes the value that made the rule trigger by exceeding the threshold of the alert rule condition. The notification also includes links to see the alert rule details, and another link to add a Silence to it.
Resolve an alert
To see how a resolved alert notification looks like, you can modify the current alert rule threshold.
To edit the Alert rule:
- Navigate to Alerting > Alert rules.
- Click on the metric-alerts folder to display the alert that you created earlier
- Click the edit button on the right hand side of the screen
- Increment the Threshold expression to 1.
- Click Save rule and exit.
By incrementing the threshold, the condition is no longer met, and after the evaluation interval has concluded (1 minute approx.), you should receive an alert notification with status “Resolved”.
Learn more in Grafana Alerting: Multi-dimensional alerts and how to route them
Tip
In Grafana Alerting: Multi-dimensional alerts and how to route them you’ll learn to use alert instances and route notifications by labels to contacts


