
Velero integration for Grafana Cloud
Velero is an open-source tool that helps backup and migrate Kubernetes cluster resources and persistent volumes. It allows you to create backups of your Kubernetes objects and restore them in case of disasters or when moving to a different environment. Velero provides a simple and reliable way to protect your Kubernetes applications and data, ensuring continuity and portability across various platforms.
This integration supports Velero 1.13+ and Kubernetes 1.16+
This integration includes 4 useful alerts and 3 pre-built dashboards to help monitor and visualize Velero metrics and logs.
Before you begin
1. Check pre-requisites specific to the Velero integration
Metrics
Metrics
Velero exposes a Prometheus metrics endpoint, /metrics, on Velero containers by default.
You can verify that this endpoint is enabled by running the following commands:
kubectl port-forward -n <namespace> <name-of-velero-pod> 8085:8085 &
curl http://localhost:8085/metrics
Logs
By default, Velero sends logs to stdout.
You can verify this by running the following command:
kubectl logs -n <namespace> <name-of-velero-pod>2. Configuration & Installation
Kubernetes Monitoring Helm chart configuration
To use this integration, modify your Kubernetes Monitoring Helm chart deployment with these configuration snippets. Metrics snippet
Copy the following and add to the .extraConfig value of the Kubernetes Monitoring Helm chart.
discovery.relabel "velero" {
  targets = discovery.kubernetes.pods.targets
  rule {
    action        = "keep"
    source_labels = ["__meta_kubernetes_pod_label_component"]
    regex         = "velero"
  }
  rule {
    source_labels = ["__meta_kubernetes_pod_container_port_number"]
    regex = "8085"
    action = "keep"
 }
  rule {
    source_labels = ["__meta_kubernetes_pod_name"]
    target_label = "instance"
  }
}

prometheus.scrape "velero" {
  job_name     = "integrations/velero"
  targets      = discovery.relabel.velero.output
  forward_to   = [prometheus.relabel.metrics_service.receiver]
}
Logs snippet
Copy the following and add to the .logs.extraConfig value of the Kubernetes Monitoring Helm chart.
discovery.relabel "logs_velero" {
  targets = discovery.relabel.pod_logs.output

  rule {
    action        = "keep"
    source_labels = ["__meta_kubernetes_pod_label_component"]
    regex         = "velero"
  }
  rule {
    action = "replace"
    source_labels = ["__meta_kubernetes_pod_name"]
    target_label  = "pod"
  }
}

loki.source.kubernetes "logs_velero" {
  targets    = discovery.relabel.logs_velero.output
  forward_to = [loki.process.logs_velero.receiver]
 }

loki.process "logs_velero" {
  forward_to = [loki.process.logs_service.receiver]
  stage.cri {}
  stage.multiline {
    firstline = "time=\"(\\d{4}-\\d{2}-\\d{2}T\\d{2}:\\d{2}:\\d{2}Z)\""
  }
  stage.regex {
    expression = "time=\"(\\d{4}-\\d{2}-\\d{2}T\\d{2}:\\d{2}:\\d{2}Z)\" level=(?P<level>\\w+)"
  }
  stage.labels {
    values = {
      level  = "",
    }
  }
}
For more information about how to set values for .extraConfig or .logs.extraConfig, see the (Helm chart documentation)[https://github.com/grafana/k8s-monitoring-helm/blob/main/charts/k8s-monitoring/docs/UsingExtraConfig.md].
Dashboards
The Velero integration installs the following dashboards in your Grafana Cloud instance to help monitor your system.
- Velero cluster view
- Velero logs
- Velero overview
Velero overview (Backups)

Velero overview (snapshots)

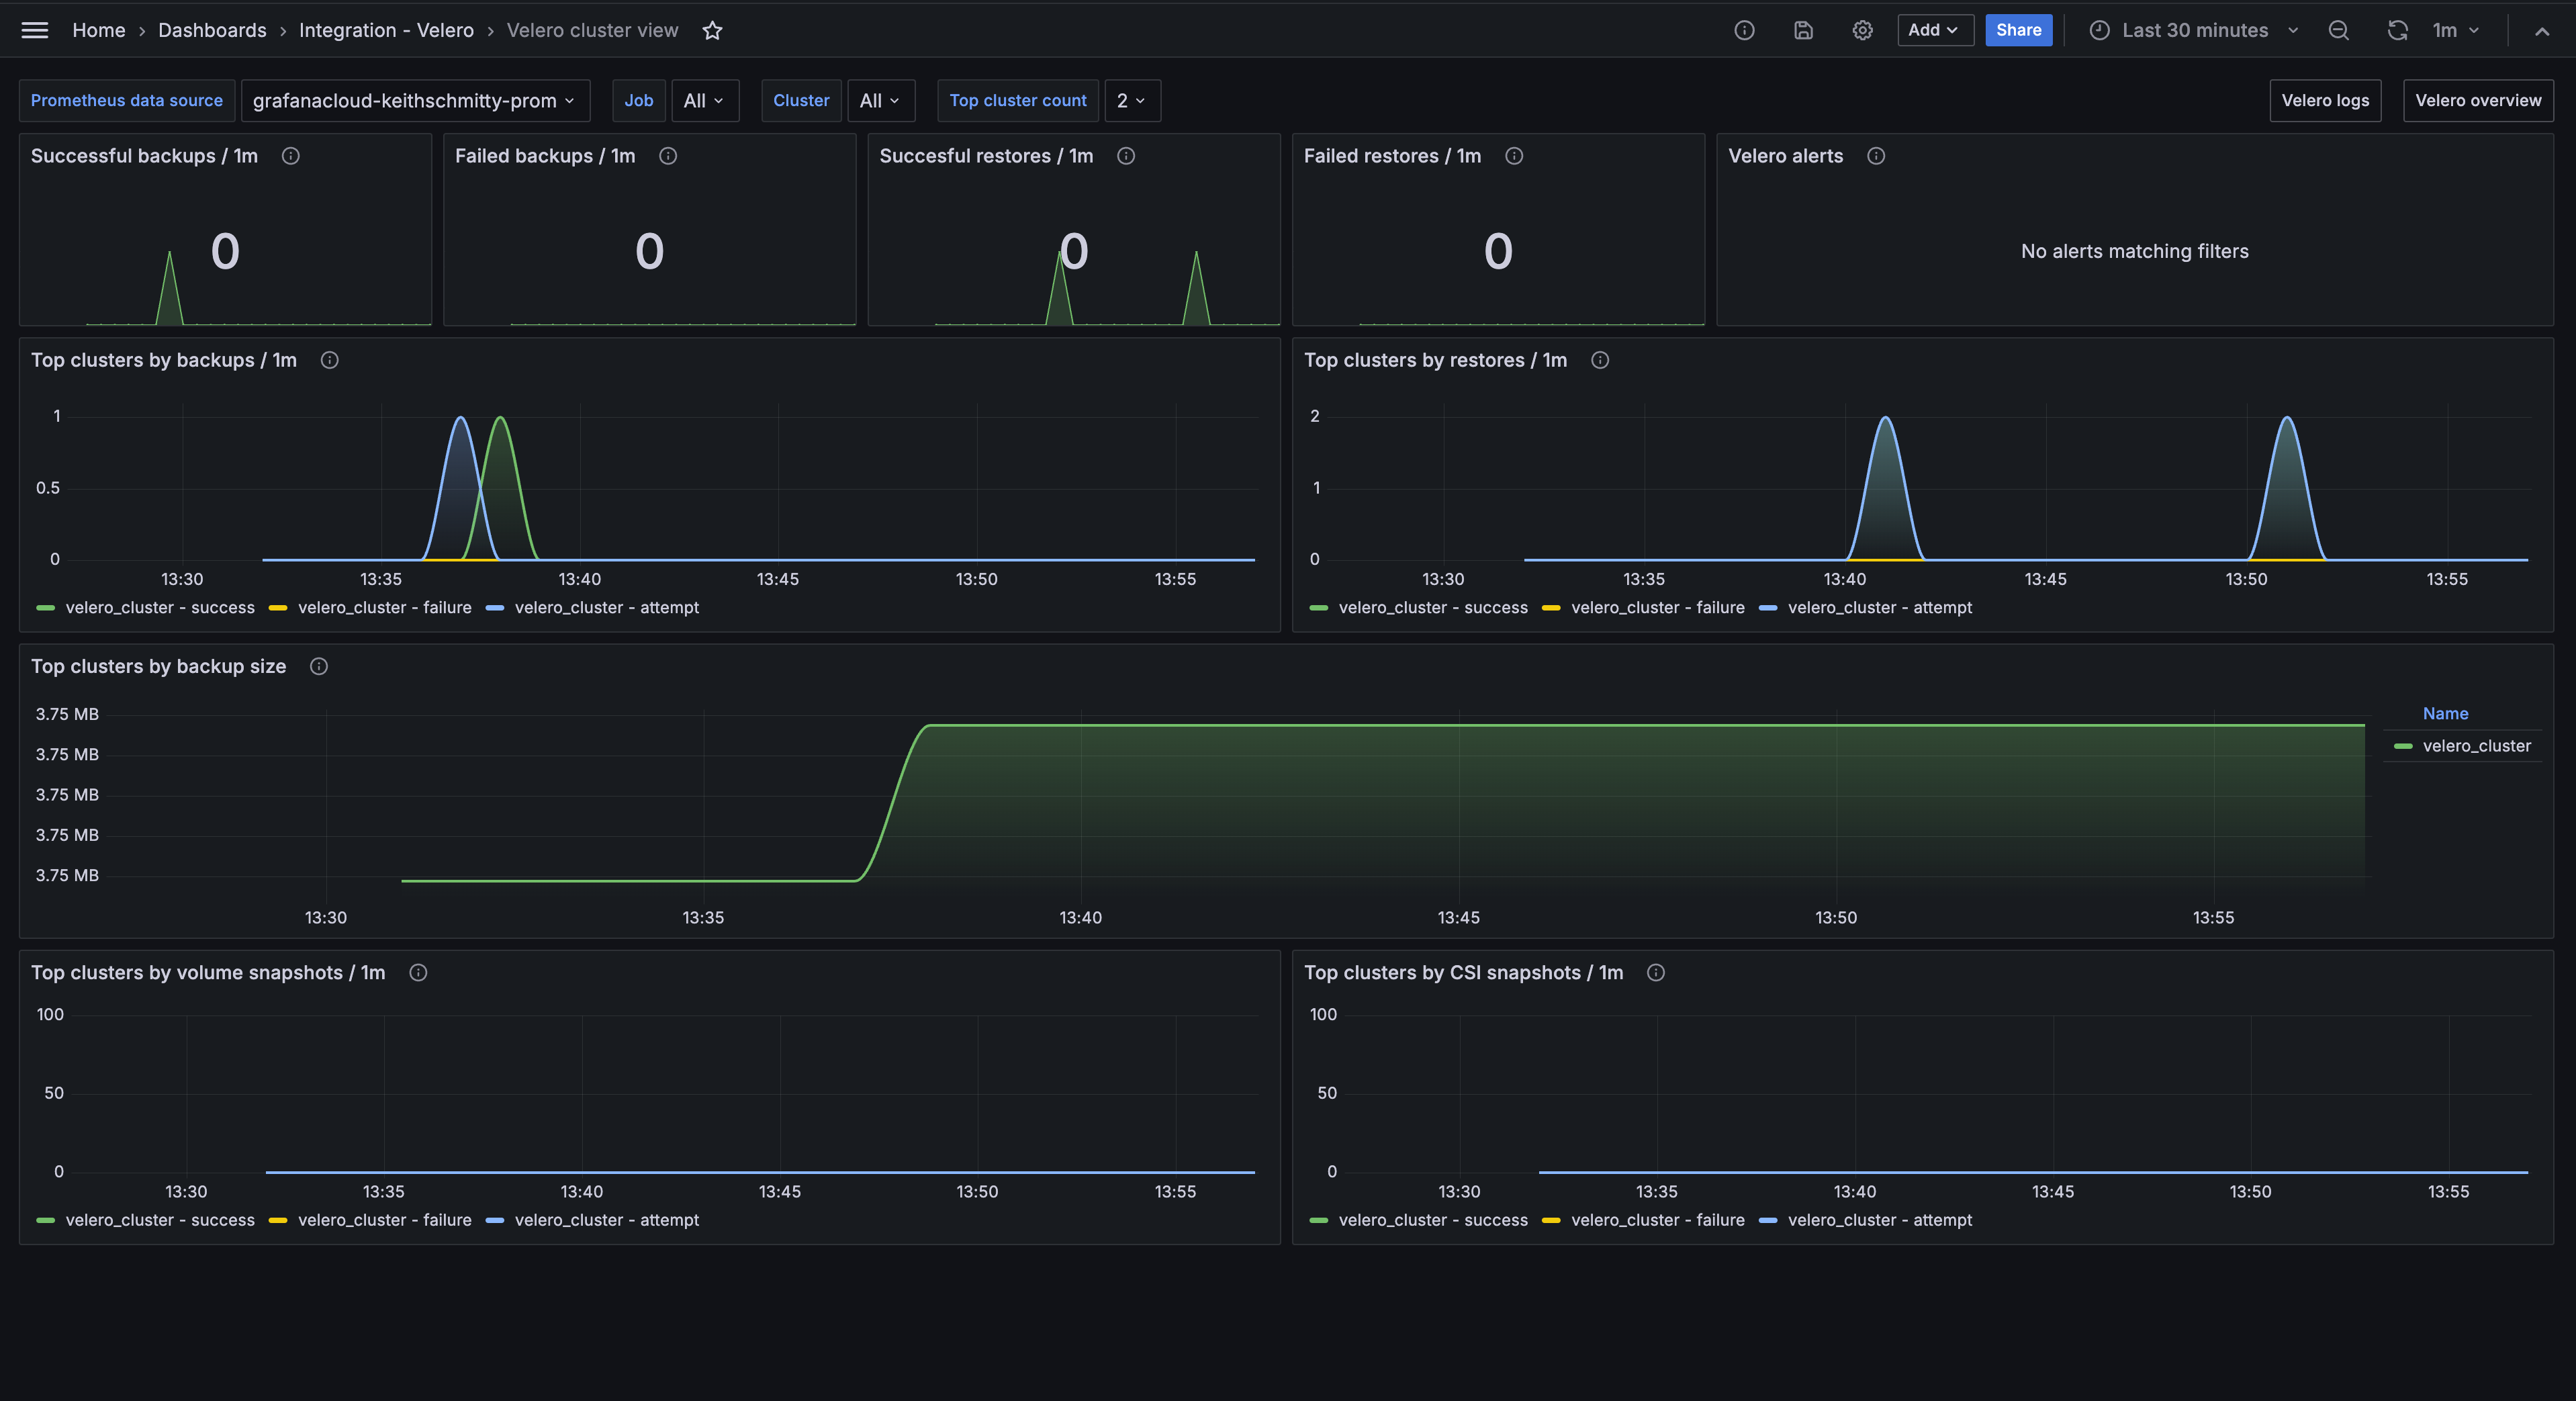
Velero cluster view
Alerts
The Velero integration includes the following useful alerts:
| Alert | Description |
|---|---|
| VeleroBackupFailure | Critical: Velero backup failures detected. |
| VeleroHighBackupDuration | Warning: Velero backups taking longer than usual. |
| VeleroHighRestoreFailureRate | Critical: Velero restore failures detected. |
| VeleroUpStatus | Critical: Velero is down. |
Metrics
The most important metrics provided by the Velero integration, which are used on the pre-built dashboards and Prometheus alerts, are as follows:
- up
- velero_backup_attempt_total
- velero_backup_duration_seconds_bucket
- velero_backup_failure_total
- velero_backup_success_total
- velero_backup_tarball_size_bytes
- velero_backup_validation_failure_total
- velero_csi_snapshot_attempt_total
- velero_csi_snapshot_success_total
- velero_restore_attempt_total
- velero_restore_failed_total
- velero_restore_success_total
- velero_restore_validation_failed_total
- velero_volume_snapshot_attempt_total
- velero_volume_snapshot_failure_total
- velero_volume_snapshot_success_total
Changelog
# 1.0.0 - April 2024

- Initial release
Cost
By connecting your Velero instance to Grafana Cloud, you might incur charges. To view information on the number of active series that your Grafana Cloud account uses for metrics included in each Cloud tier, see Active series and dpm usage and Cloud tier pricing.
Was this page helpful?
Related resources from Grafana Labs


