
Traefik integration for Grafana Cloud
Traefik is a dynamic load balancer designed for ease of configuration, especially in dynamic environments. It supports automatic discovery of services, metrics, tracing, and has Let’s Encrypt support out of the box. Traefik provides a “ready to go” system for serving production traffic with these additions.
This integration includes 1 pre-built dashboard to help monitor and visualize Traefik metrics.
Before you begin
You need to enable the Prometheus metrics endpoint in your Traefik node. Please follow the official documentation.
Install Traefik integration for Grafana Cloud
- In your Grafana Cloud stack, click Connections in the left-hand menu.
- Find Traefik and click its tile to open the integration.
- Review the prerequisites in the Configuration Details tab and set up Grafana Agent to send Traefik metrics to your Grafana Cloud instance.
- Click Install to add this integration’s pre-built dashboard to your Grafana Cloud instance, and you can start monitoring your Traefik setup.
Configuration snippets for Grafana Alloy
Simple mode
These snippets are configured to scrape a single Traefik instance running locally with default ports.
First, manually copy and append the following snippets into your alloy configuration file.
Metrics snippets
discovery.relabel "metrics_integrations_integrations_traefik" {
	targets = [{
		__address__ = "localhost:8080",
	}]

	rule {
		target_label = "instance"
		replacement  = constants.hostname
	}
}

prometheus.scrape "metrics_integrations_integrations_traefik" {
	targets    = discovery.relabel.metrics_integrations_integrations_traefik.output
	forward_to = [prometheus.remote_write.metrics_service.receiver]
	job_name   = "integrations/traefik"
}
Advanced mode
The following snippets provide examples to guide you through the configuration process.
To instruct Grafana Alloy to scrape your Traefik instances, manually copy and append the snippets to your alloy configuration file, then follow subsequent instructions.
Advanced metrics snippets
discovery.relabel "metrics_integrations_integrations_traefik" {
	targets = [{
		__address__ = "localhost:8080",
	}]

	rule {
		target_label = "instance"
		replacement  = constants.hostname
	}
}

prometheus.scrape "metrics_integrations_integrations_traefik" {
	targets    = discovery.relabel.metrics_integrations_integrations_traefik.output
	forward_to = [prometheus.remote_write.metrics_service.receiver]
	job_name   = "integrations/traefik"
}
To monitor your Traefik instance, you must use a discovery.relabel component to discover your Traefik Prometheus endpoint and apply appropriate labels, followed by a prometheus.scrape component to scrape it.
Configure the following properties within each discovery.relabel component:
__address__: The address to your Traefik Prometheus metrics endpoint.instancelabel:constants.hostnamesets theinstancelabel to your Grafana Alloy server hostname. If that is not suitable, change it to a value uniquely identifies this Traefik instance.
If you have multiple Traefik servers to scrape, configure one discovery.relabel for each and scrape them by including each under targets within the prometheus.scrape component.
Grafana Agent static configuration (deprecated)
The following section shows configuration for running Grafana Agent in static mode which is deprecated. You should use Grafana Alloy for all new deployments.
Before you begin
You need to enable the Prometheus metrics endpoint in your Traefik node. Please follow the official documentation.
Install Traefik integration for Grafana Cloud
- In your Grafana Cloud stack, click Connections in the left-hand menu.
- Find Traefik and click its tile to open the integration.
- Review the prerequisites in the Configuration Details tab and set up Grafana Agent to send Traefik metrics to your Grafana Cloud instance.
- Click Install to add this integration’s pre-built dashboard to your Grafana Cloud instance, and you can start monitoring your Traefik setup.
Post-install configuration for the Traefik integration
After enabling the metrics generation, instruct Grafana Agent to scrape your Traefik nodes.
Traefik exposes a /metrics endpoint. To scrape it, add the provided snippet to your agent configuration file.
Make sure to change targets in the snippet according to your environment.
Configuration snippets for Grafana Agent
Below metrics.configs.scrape_configs, insert the following lines and change the URLs according to your environment:
    - job_name: integrations/traefik
      relabel_configs:
        - replacement: '<your-instance-name>'
          target_label: instance
      static_configs:
        - targets: ['localhost:8080']
Full example configuration for Grafana Agent
Refer to the following Grafana Agent configuration for a complete example that contains all the snippets used for the Traefik integration. This example also includes metrics that are sent to monitor your Grafana Agent instance.
integrations:
  prometheus_remote_write:
  - basic_auth:
      password: <your_prom_pass>
      username: <your_prom_user>
    url: <your_prom_url>
  agent:
    enabled: true
    relabel_configs:
    - action: replace
      source_labels:
      - agent_hostname
      target_label: instance
    - action: replace
      target_label: job
      replacement: "integrations/agent-check"
    metric_relabel_configs:
    - action: keep
      regex: (prometheus_target_sync_length_seconds_sum|prometheus_target_scrapes_.*|prometheus_target_interval.*|prometheus_sd_discovered_targets|agent_build.*|agent_wal_samples_appended_total|process_start_time_seconds)
      source_labels:
      - __name__
  # Add here any snippet that belongs to the `integrations` section.
  # For a correct indentation, paste snippets copied from Grafana Cloud at the beginning of the line.
logs:
  configs:
  - clients:
    - basic_auth:
        password: <your_loki_pass>
        username: <your_loki_user>
      url: <your_loki_url>
    name: integrations
    positions:
      filename: /tmp/positions.yaml
    scrape_configs:
      # Add here any snippet that belongs to the `logs.configs.scrape_configs` section.
      # For a correct indentation, paste snippets copied from Grafana Cloud at the beginning of the line.
metrics:
  configs:
  - name: integrations
    remote_write:
    - basic_auth:
        password: <your_prom_pass>
        username: <your_prom_user>
      url: <your_prom_url>
    scrape_configs:
      # Add here any snippet that belongs to the `metrics.configs.scrape_configs` section.
      # For a correct indentation, paste snippets copied from Grafana Cloud at the beginning of the line.
    - job_name: integrations/traefik
      relabel_configs:
        - replacement: '<your-instance-name>'
          target_label: instance
      static_configs:
        - targets: ['localhost:8080']
  global:
    scrape_interval: 60s
  wal_directory: /tmp/grafana-agent-wal
Dashboards
The Traefik integration installs the following dashboards in your Grafana Cloud instance to help monitor your system.
- Traefik
Service Stats Overview
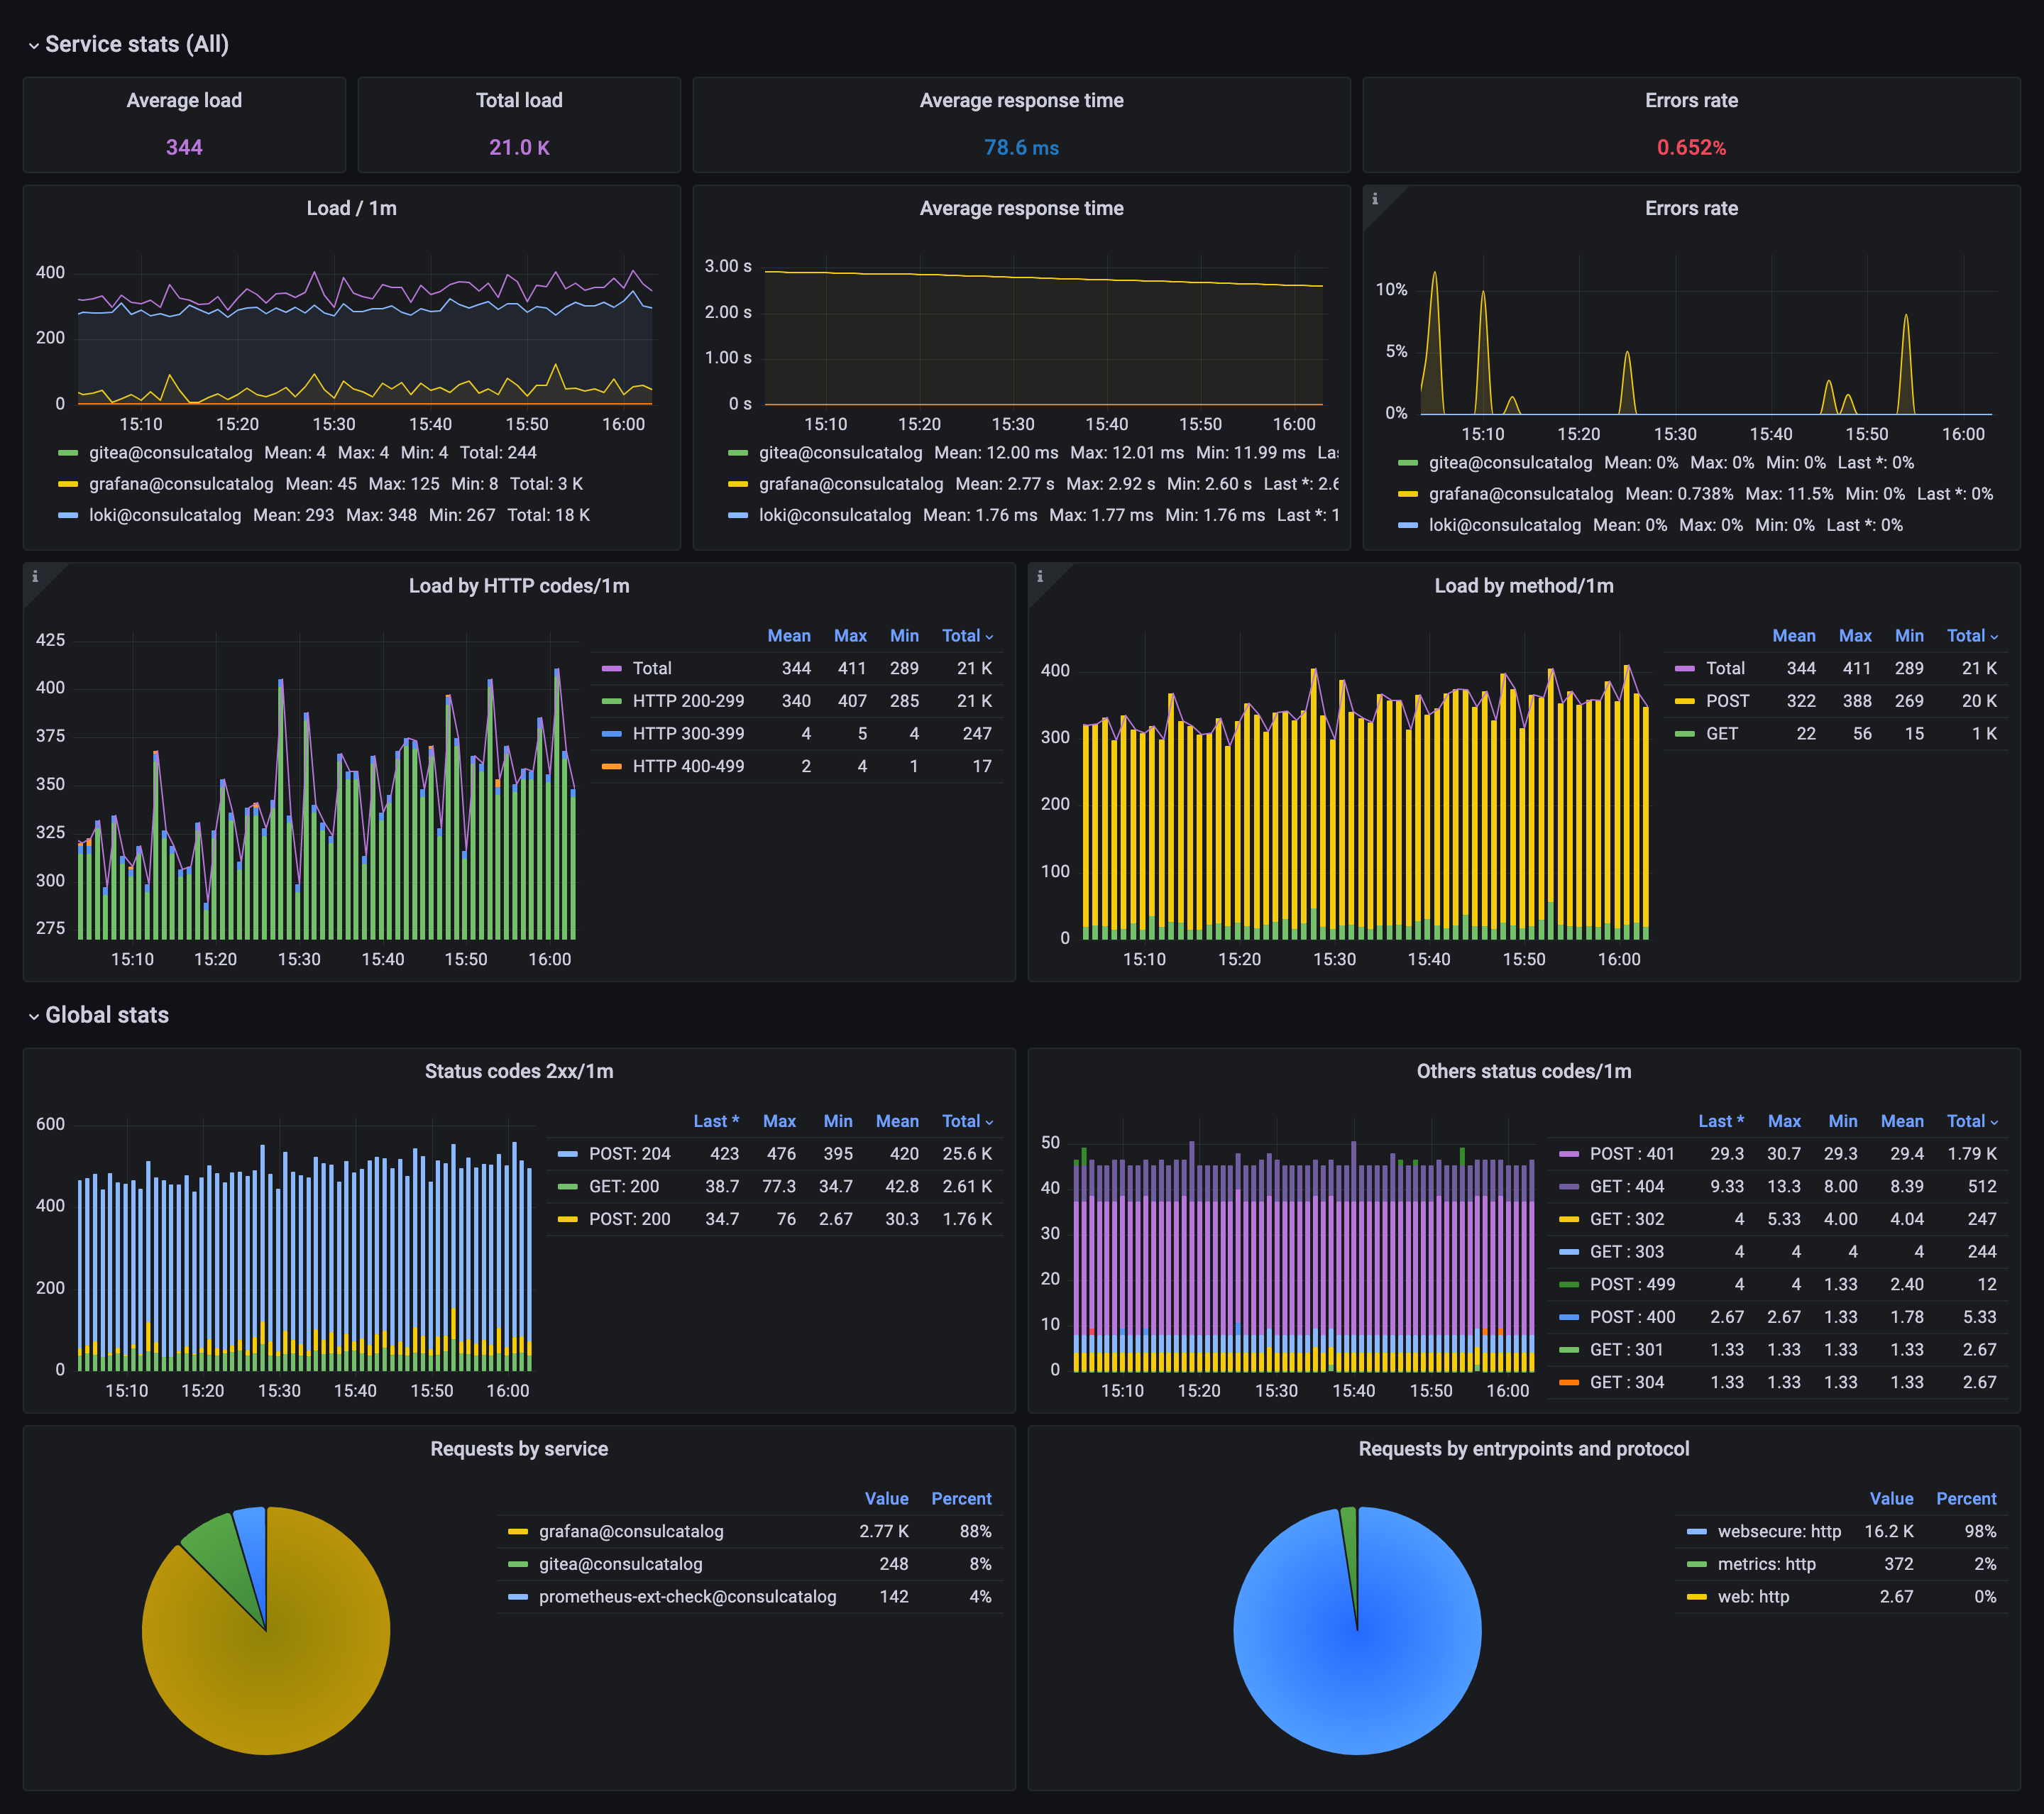
Service Stats Filter

Metrics
The most important metrics provided by the Traefik integration, which are used on the pre-built dashboard, are as follows:
- traefik_entrypoint_requests_total
- traefik_service_request_duration_seconds_sum
- traefik_service_requests_total
- up
Changelog
# 0.0.6 - September 2023

* New Filter Metrics option for configuring the Grafana Agent, which saves on metrics cost by dropping any metric not used by this integration. Beware that anything custom built using metrics that are not on the snippet will stop working.
* New hostname relabel option, which applies the instance name you write on the text box to the Grafana Agent configuration snippets, making it easier and less error prone to configure this mandatory label.

# 0.0.5 - March 2023

* Fix errors rate calculation

# 0.0.4 - September 2022

* Update total calls panel
* Fix traefik panel's query with hardcoded value
* Add job variable refresh on time range (for faster dashboard update when very first metric comes to prometheus)
* Add negative offset for better calculation of total number of calls/error over dashboard's range

# 0.0.3 - September 2022

* Update dashboard panels descriptions.

# 0.0.2 - October 2021

* Update mixin to latest version:
  - Update queries to use $__rate_interval

# 0.0.1 - July 2021

* Initial release.
Cost
By connecting your Traefik instance to Grafana Cloud, you might incur charges. To view information on the number of active series that your Grafana Cloud account uses for metrics included in each Cloud tier, see Active series and dpm usage and Cloud tier pricing.
Was this page helpful?
Related resources from Grafana Labs


