
Translate Datadog metrics into OTLP with the OpenTelemetry Collector and Grafana Alloy
Today, we are excited to announce that we are releasing new code for the OpenTelemetry Datadog receiver as open source. This code allows users to translate Datadog metric formats into native OTLP format. These metrics can then be sent to any OpenTelemetry-compatible metrics system, whether it’s Prometheus, Grafana Mimir, or another backend database.
A core value at Grafana Labs is embracing the “big tent” philosophy, demonstrated in the past when we stepped up as reviewers and code co-owners of the Datadog receiver for traces proposed by the OTel community, or when we built the Loki receiver. We believe in empowering our users to make their own choices in their observability strategy. We prioritize interoperability and reducing vendor lock-in, and we are big believers in the value of open source.
Our code for the OpenTelemetry Datadog receiver started as a project to support the migration of a large customer. In the spirit of getting working code into as many hands as soon as possible, we have made it available as of today in Grafana Alloy, our distribution of the OpenTelemetry Collector that uniquely provides native pipelines for both OpenTelemetry and Prometheus formats. Based on this codebase, we have submitted the first PR to OpenTelemetry and will work through normal channels to get all of our work merged. As we expect this code to change based on community review and feedback, this feature is marked as experimental in Grafana Alloy. Once our code has been merged into OpenTelemetry’s upstream main branch, we will update and release it as stable within Grafana Alloy as well.
Translate Datadog metrics to OTLP: how it works
Editor’s note: Datadog, Prometheus, and OpenTelemetry use different terminology for metric types. In this blog, we are using the OpenTelemetry terminology, unless otherwise noted.

Datadog’s official documentation provides thorough information about their metric types: Count, Gauge, Rate, Histogram and Distribution.
The process of translating Count, Gauge, and Rate metric types was relatively straightforward, as each of these can be mapped fairly directly to an OpenTelemetry metric format. Datadog Gauge metrics can be mapped to OpenTelemetry Gauge metrics, and Count and Rate metrics can be mapped to OpenTelemetry Sum metrics (with an adjustment to the value for Rate metrics to factor in the interval).
The Datadog Distribution metric type can most closely be mapped to OpenTelemetry’s Exponential Histogram metric type. This was a more challenging translation, due to differences in how the bucket boundaries are defined in the two systems. A best-effort translation was implemented to minimize loss of accuracy in the resulting Exponential Histogram.
More details about the technical implementations will be featured in a future blog post.
From Datadog metrics to Prometheus metrics
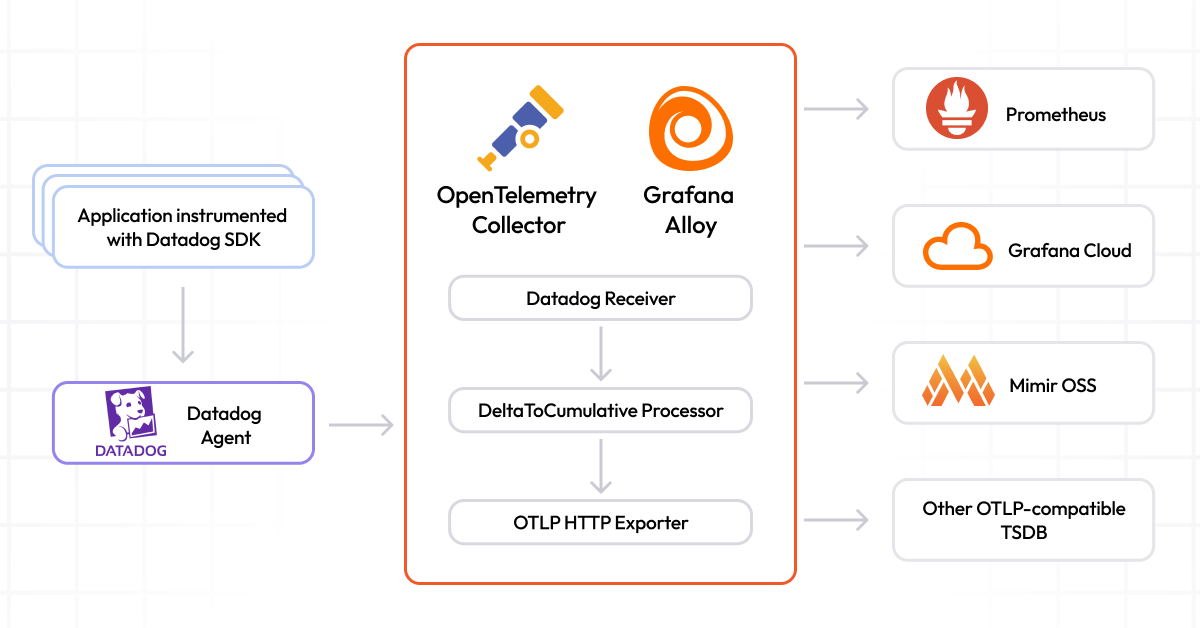
Once you enable the Datadog receiver, the collector will effectively be working with OpenTelemetry metrics coming from your Datadog-instrumented applications. You could choose from a wide range of collector exporters to write those metrics to specific backends. However, our recommendation is that you use the default OTLP exporter to make your pipeline as OTel native as possible.
It is important to note that the OpenTelemetry specification defines two different temporalities. If you intend to write to Prometheus, Mimir OSS, or Grafana Cloud, a processor is required to convert between these temporalities.
For such use cases, we have built and contributed an open source processor, known as the deltatocumulative processor. Once OTLP metrics come out of the Datadog receiver and pass through this processor, they’re ready for export via the OTLP HTTP exporter to Prometheus’s native OTLP endpoint or other systems, such as Grafana Cloud.
We plan to publish technical deep dive blogs on the deltatocumulative processor in the future.
How to get started translating Datadog metrics to OTLP
We expect that the upstream review process will take a few weeks as we coordinate with the OpenTelemetry community. At the same time, we want to enable you to try this out today, so we have included the receiver and the processor in the Grafana Alloy v1.2.0 release candidate.

Here’s an Alloy configuration example:
otelcol.processor.deltatocumulative “example” {
  max_stale = “5m”
  max_streams = 10000
  output {
    metrics = [otelcol.processor.batch.example.input]
  }
}

otelcol.processor.batch “example” {
  output {
    metrics = [otelcol.exporter.otlp.default.input]
  }
}

otelcol.receiver.datadog “example” {
  endpoint = “localhost:4444”
  output {
    metrics = [otelcol.processor.deltatocumulative.example.input]
  }
}
How to configure Datadog Agent to send data to Alloy
You can set up your Datadog Agent to forward Datadog metrics simultaneously to Alloy and Datadog. We recommend this approach for current Datadog users who would like to try this out.
Add the following environment variable to your datadog-agent installation where port is the previously configured port for the Datadog receiver.
DD_ADDITIONAL_ENDPOINTS='{"http://<alloy_endpoint>:<port>": ["grafana-labs"]}'You can also set up your Datadog Agent to forward all your metrics to Alloy by updating the Datadog URL either in the configuration yaml:
dd_url: http://<alloy_endpoint>:<port>Or by environment variable:
DD_DD_URL=http://<alloy_endpoint>:<port>For a step-by-step guide, check out our Alloy documentation.
Tell us what you think!
As always, community feedback is welcome and appreciated! Please file any issues you find with the receiver in the upstream opentelemetry-collector-contrib repository in GitHub.
In addition to this new solution for Datadog metrics ingestion, Grafana Labs can help customers automate the migration of their dashboards, alerts, and SLOs from Datadog to Grafana Cloud. These migrations are led by our dedicated Professional Services team and can vastly shorten the amount of time needed to move an organization with a large investment in Datadog to Grafana Cloud. To learn more, reach out to customer support.
Grafana Cloud is the easiest way to get started with metrics, logs, traces, dashboards, and more. We have a generous forever-free tier and plans for every use case. Sign up for free now!


