Streamlining runtime diagnostics with on-demand profiling: Inside Roblox's observability stack
Each day, more than 70 million active users sign into Roblox to create, play, and interact with each other through virtual experiences. And regardless of what those experiences are, exactly — adopting a pet, completing an obstacle course, or fulfilling orders at a virtual pizza parlor — the Roblox observability team is dedicated to making them seamless.
“How many of you feel pretty happy if you or your kids can hang out with friends and have fun — without any interruptions — on Roblox?” asked Xiaofeng Han, head of observability for the social and gaming platform, at a recent ObservabilityCON on the Road event in the San Francisco Bay Area.
As attendees across the room raised their hands in response, Han nodded. “Right,” he said. “Reliability is very important.”
In their talk, Scaling Roblox’s runtime diagnosis system with Grafana Pyroscope, Han and his colleague Jialin Jiao, principal engineer and engineering manager at Roblox, explored the challenges their team faced when debugging in production — and how the on-demand profiling workflow they built with Grafana Pyroscope allowed them to overcome those challenges to provide a continuous, uninterrupted experience for Roblox’s global user base.
Note: Roblox’s session from ObservabilityCON on the Road 2024 is now available to watch on demand. You can check out the full session on YouTube below.
The challenge: debugging at scale
To say that Roblox is popular would be an understatement.
In addition to its 71.5 million daily users, Roblox is home to 2.4 million developers who, collectively, have built 4.4 million digital experiences, making it one of the largest social and metaverse platforms on the planet.
Perhaps unsurprisingly, underpinning all these interactive experiences is a pretty complex IT infrastructure.

“Roblox still runs primarily on premises,” Han explained. “We have our major data centers within the U.S. and we have our edge data centers distributed globally. Together, we have over 1,000 microservices running on hundreds of thousands of machines. So, as you can imagine, there are a lot of challenges around how we monitor debugging and keep the system up.”
In particular, the way the team handled runtime diagnostics was fraught with challenges. Using profiling as an example, Jiao walked attendees through the former (and tedious) process.
First, when a service disruption occurred, an engineer would have to request temporary access to the production environment, which required admin approval, and then log into a production instance. Next, the engineer would install and run a profiling tool, download the profiling data, and then visualize and analyze that data locally. Lastly, after the engineer found the information they needed, the admin would then have to revoke their production access. That cycle would repeat for any new disruptions.
“There were so many pain points,” Jiao said. “It’s manual and inefficient, and there are actually security and privacy issues when people log into the production server.”
The solution: on-demand profiling with Grafana Pyroscope
Faced with these challenges, the Roblox observability team started to search for a way to scale and streamline their runtime diagnostics process.
Last year, after some proof-of-concepts and performance evaluations for both .NET and Go, the team decided to build an end-to-end, on-demand profiling workflow with Grafana Pyroscope.
“We conducted a comprehensive performance evaluation on Pyroscope, measured the performance impact, and it proved it to be very acceptable to us,” Jiao told attendees.
Then, with Grafana Pyroscope added to their toolchain, Roblox engineers began to transform the way they debug in production.
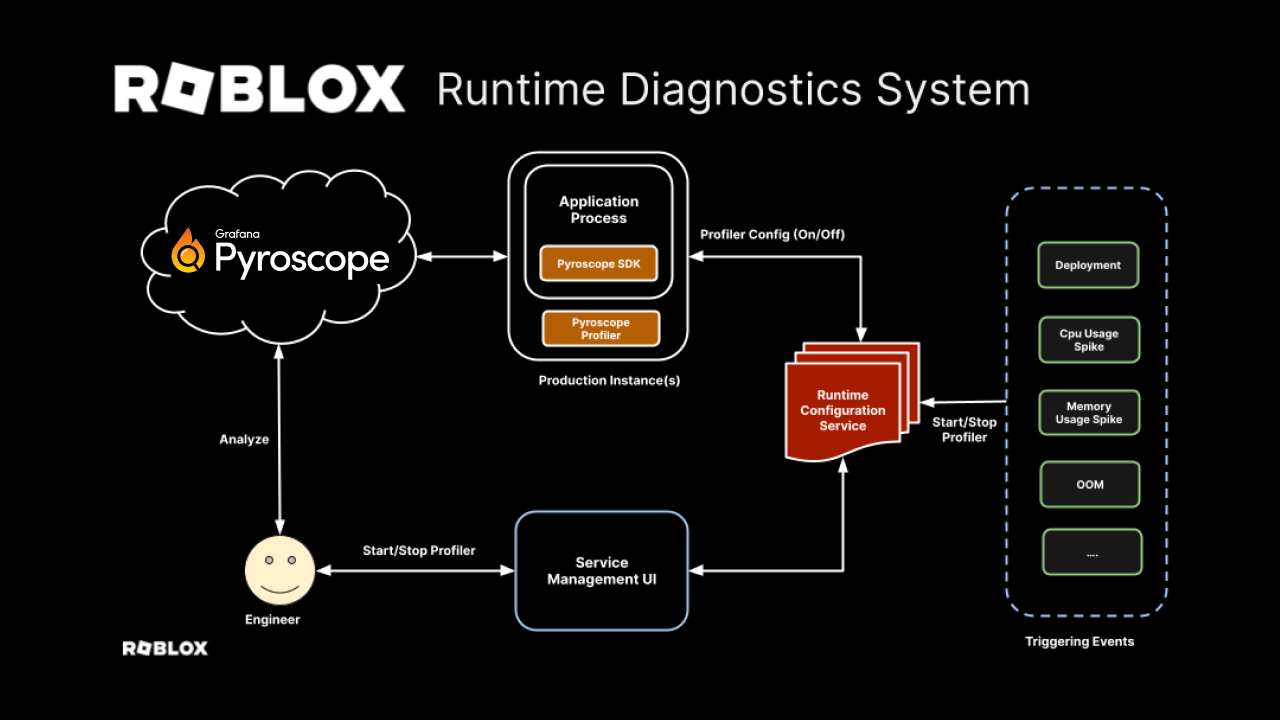
“We baked the Profiler into our container-based image. Our service framework continuously monitors our runtime configuration service to listen to when we need to provide which instances for how long, or when to turn them off,” Jiao said. “Once they get the signal, they actually call the Pyroscope SDK to dynamically control the Profiler.”
Roblox engineers use an internal web-based UI to update the runtime configuration, and all profiling data is uploaded into Grafana Cloud Profiles, Jiao added.
Looking ahead, the team plans to advance this system further by adopting what Jiao called event-based profiling. In this model, a service-critical event — such as a new deployment, or a CPU or memory issue — immediately and automatically triggers profiling.
Jiao said he views Roblox’s current on-demand profiling system, as well as event-based profiling, as “stepping stones” towards eventually implementing continuous profiling — a modern and highly scalable profiling approach for production environments.
“Pyroscope has been built for continuous profiling since the beginning,” Jiao said. “That’s why we actually required some in-depth technical support, as well as a new API from the SDK, [to enable on-demand profiling]. Fortunately, we’ve had a great partner in the Grafana Labs team; their technical support is awesome.”
The results (so far): identifying and eliminating bottlenecks
Even if the long-term goal is continuous profiling, Roblox has already benefited significantly from their move to Grafana Pyroscope. Since implementing on-demand profiling and their revamped diagnostics system, they’ve received “overwhelmingly positive feedback” from engineers, Jiao said.
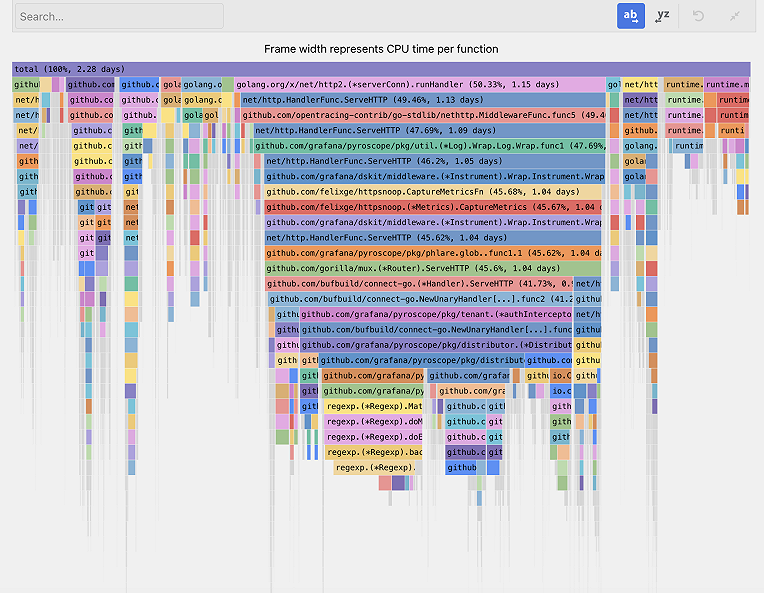
In particular, those engineers appreciate that they can now discover and address bottlenecks far more quickly and efficiently. As one example, a team of engineers was able to identify and replace a poor-performing JSON library, which resulted in a 36% reduction in CPU usage. Similarly, on-demand profiling led the team to replace a regular expression matching pattern with a simple array lookup — another fairly simple change that led to a 40% reduction in CPU usage.
In another example, a team of Roblox engineers used on-demand profiling when optimizing and hardening a new service to discover the root cause of a performance issue and realize a 10x improvement in throughput.

Traditionally, logs, metrics, and traces have been considered the three pillars of observability, noted Han at the end of the ObservabilityCON on the Road talk. But with Grafana Pyroscope — and their partnership with the Grafana Labs team — Roblox has been able to embrace a fourth (and critical) pillar: runtime diagnostics with profiling.
“Together, we try to leverage all the data we have to continue to improve the reliability, productivity, and efficiency of Roblox systems and hopefully provide a continuous, uninterrupted, no-downtime experience for our clients,” he said.
Grafana Cloud is the easiest way to get started with continuous profiling, metrics, logs, traces, and dashboards. We have a generous forever-free tier and plans for every use case. Sign up for free now!