5 useful transformations you should know to get the most out of Grafana
I’ve been a user of Grafana OSS for seven years, starting with Grafana 5.0. My, how things have evolved since then. The first time I used Grafana was to monitor a Kafka data pipeline with a bunch of Java Spring Boot microservices and Prometheus to extract metrics. I was amazed how much you could do with Grafana and Prometheus together, and so I always kept Grafana on my short list of places I wanted to put my energy, either as a contributor or by working directly for the company.
Fast forward roughly four years and I found myself supporting development teams and noticed Grafana Labs had a similar opportunity within the Grafana product department. I jumped on board and the rest is history. Today, I’m an engineering director here at Grafana Labs, and lately I’ve been using Grafana to understand how my team’s projects were doing. In the process, I’ve found that using Grafana to analyze tabular data is actually quite awesome with the use of transformations.
You can use dozens of transformations in Grafana to manipulate data returned by a query before it’s applied to a visualization. It’s a really powerful feature, especially if you need multiple views of your data. In this blog post, I’ll share my top five transformations in the hope that they can help you better understand your data, too.
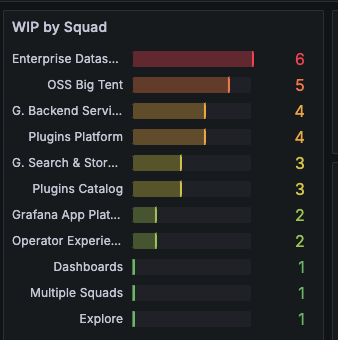
1. Group by
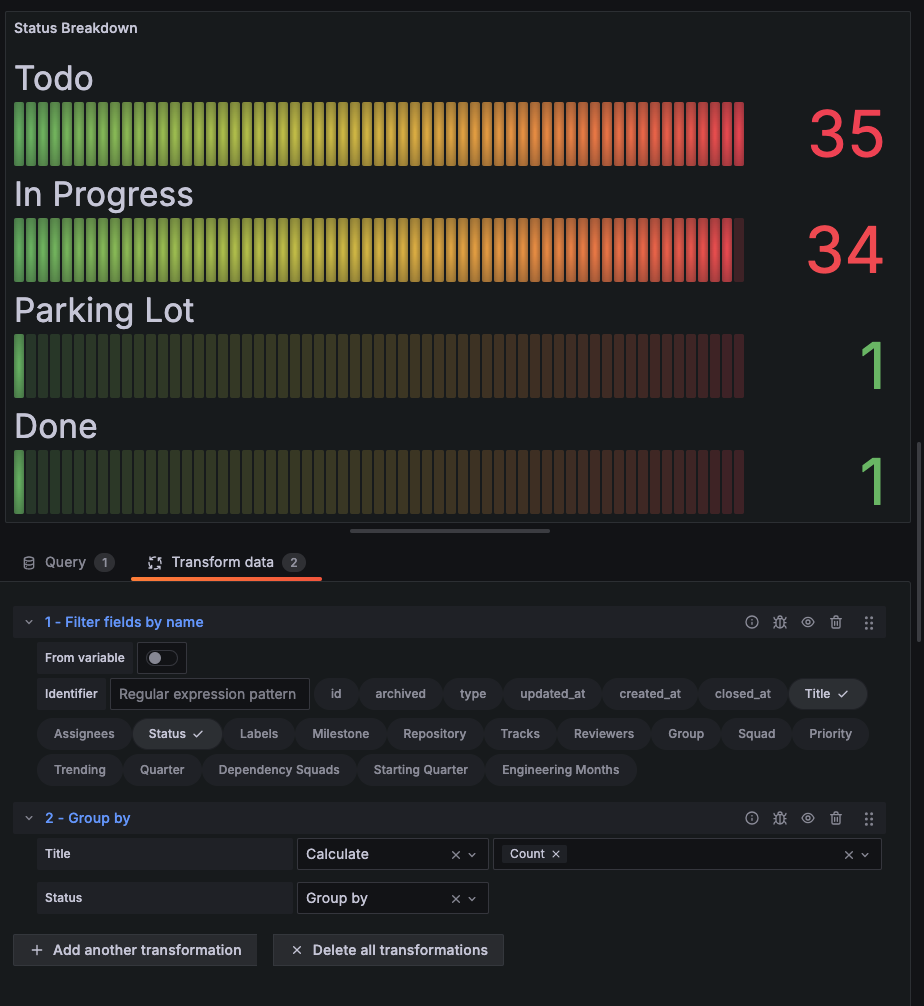
Having a database background, I really love the group by function. This is a super valuable tool to create bar charts based on counts. In the example below, I first filter down to just the columns of the table I need — status and title (for counting) — and then do a group by on the status, with the title being the ID field so we can count the number of records. Super easy, and it makes a nice bar graph. Find out more here.
2. Organize fields by name
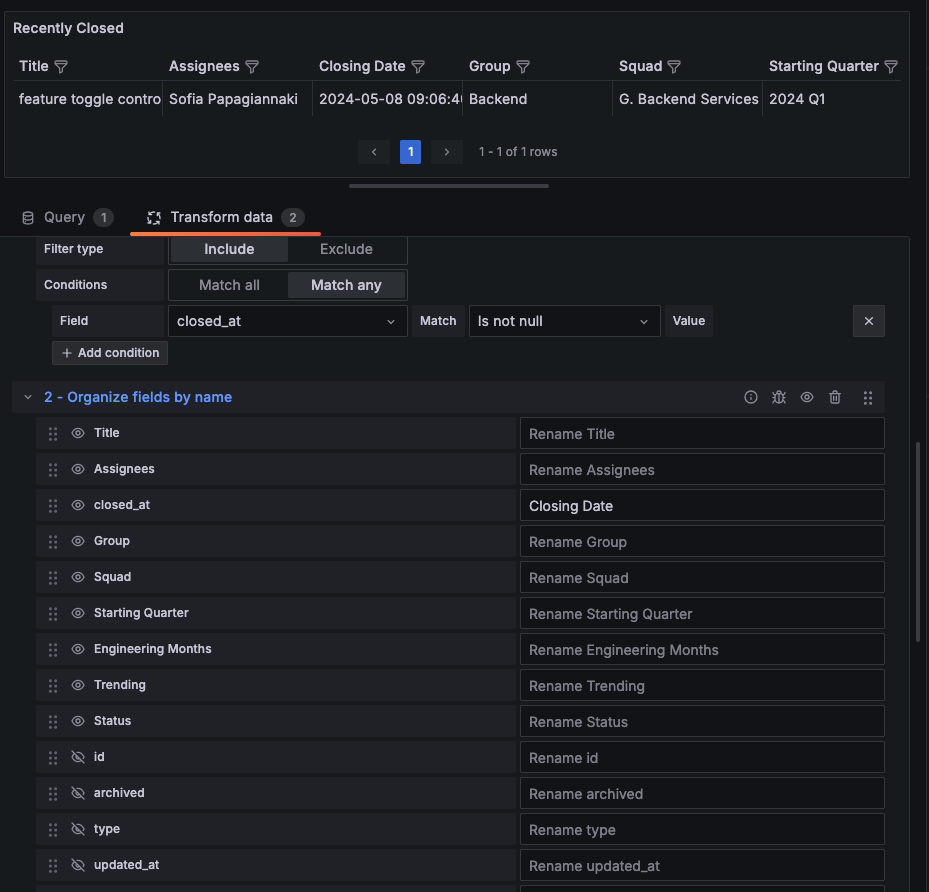
The organize fields by name transformation is a powerful tool that allows you to manipulate data returned by a query before applying any visualization in Grafana. Its primary purpose is to help you structure and present your data effectively. Here are the key aspects of this transformation:
Column renaming
- You can easily rename columns in your dataset. This feature is particularly useful when the original column names are cryptic or not user-friendly.
- For example, if your query returns a column named “col1,” you can rename it to something more descriptive like “Sales Revenue.”
Column hiding
- Sometimes, certain columns are not relevant for display in your visualization. This transformation allows you to hide specific columns.
- By hiding unnecessary columns, you can declutter your visualization and focus on the essential information.
Column reordering
- Reorganizing columns is crucial for displaying data in the desired order. The transformation lets you rearrange columns as needed.
- For instance, if your table has columns for “Date,” “Product,” and “Sales,” you can reorder them to present the data logically (e.g., Date → Product → Sales).
Custom headings
- The transformation also enables you to set custom headings for columns. This feature is valuable when you want to provide more context or improve readability.
- Instead of using generic headings like “Column A,” you can specify meaningful labels such as “Product Name” or “Total Units Sold.”
Simplicity and power
- Despite its versatility, this transformation remains straightforward to use. You can quickly configure it within your Grafana panel.
- By combining renaming, hiding, and reordering, you can create a clean, informative table that presents the right information in the right order.
Find out more about this transformation here.
3. Filter data by value
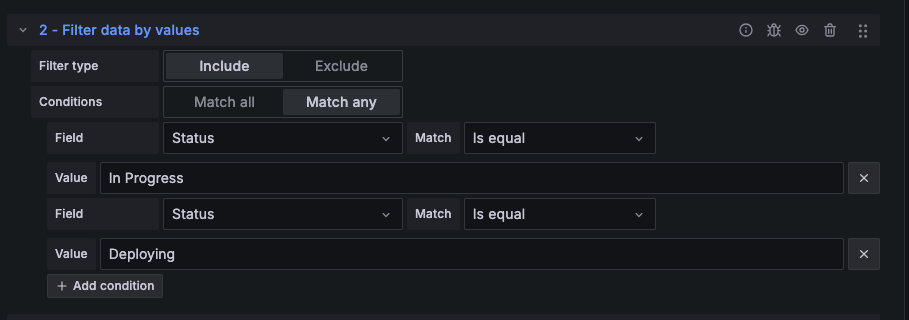
Filter data by value is another great way to filter down to the right level of information for your panel. I really enjoy the ability to do AND operations here, or OR operations with “Match all” or “Match any” options. To me, that is super helpful for chaining together a bunch of conditions. In this example I’m filtering down to issues that are in In Progress or Deploying statuses.
Recently, we added a way of doing “filter by substring value” as a match type. Combined with variable support (feature toggle) for transformations, that can make filtering in your dashboard trivial. Read more about the filter data by value transformation here.
4. Sort by
Sometimes our data comes out in different orders than what we want to visualize — or in no order at all. The sort by transformation is so helpful for single column sort. This is especially useful after a group by so you can sort by count (descending), so the bar chart has the highest value on top. Read more about this transformation here.

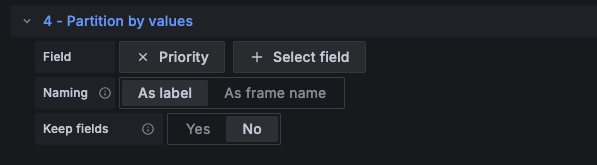
5. Partition by values
Partition by values is an amazing, magical transformation. The major use case for this transform is taking a single SQL result (which is a long/tall frame), and splitting it into multiple series. Before this existed, you had to do a query per series, and you had to know in advance what those series were!
This transformation takes a single table, and cuts it into N tables based on a field or fields. This is so handy for breaking out a single dataset into multiple. In the example below I broke out a list of customer escalations by priority so that I could understand the p50 and p99 of cycle time by priority. Handy. Super useful for XY datasets, bar charts, etc. Read more about partitioning by values here.
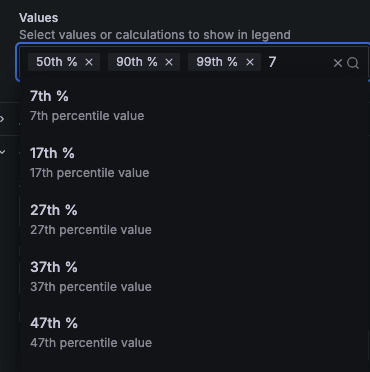
Bonus: percentiles in group by and legend
A while back I wanted a way to understand the 99th percentile of a field, but with the legend you could only do basic math (max, min, count, etc.). So I added in a way of doing any percentile (1-99). This is now available in Grafana Cloud, and will be rolling out to on-premises deployments with Grafana 11.1. You can see this both in the “value” option of Legend, as well as an option for calculating in a group by. Enjoy!
Get started with transformations today
I’ve just scratched the surface in terms of what you can do with transformations; there are more than 30 different transformation functions in Grafana. And while the ones listed above are my personal favorites, there are plenty more that might fit your use case better. Go to our docs to learn more, and feel free to reach out in our community forums if you have any questions.
Grafana Cloud is the easiest way to get started with metrics, logs, traces, dashboards, and more. We have a generous forever-free tier and plans for every use case. Sign up for free now!