

How to monitor steel alloys with Grafana: the story of a Golden Grot Awards winner
Every great Grafana dashboard seems to have that “aha” moment — when users switch from thinking about the data in the abstract to thinking of it as something tangible and instantly actionable. For Christopher Field, co-founder and president of Theia Scientific, that moment happens every time he shows his dashboard to scientific researchers accustomed to long, drawn out data analysis processes.
“One of the great things about the dashboard is that we show it and the software that we’ve built and the platform that we’ve developed, it’s seeing the scientists have that light bulb come on,” Christopher says. “You can literally just see it when they see it in action.”
Our eyes lit up, too, which is why Christopher is one of this year’s winners of the Golden Grot Awards, our annual awards honoring the very best in personal and professional dashboards. His win in the professional dashboard category is a testament to all the non-traditional use cases for Grafana dashboards, as his company uses it to monitor the growth of defects in steel alloys caused by exposure to radiation for next-generation nuclear fission reactors and fusion energy.
“It validates the original concept that we had of this customization and the visualization and using a web stack with a microscope,” he says. “Grafana is doing all of this with observability and doing it on the IT side with DevOps and monitoring your web application, and we kind of said, ‘Let’s do it for the observability of science. Does that apply? Does it actually translate and does it work?’ And this validates that, yes, it does.”
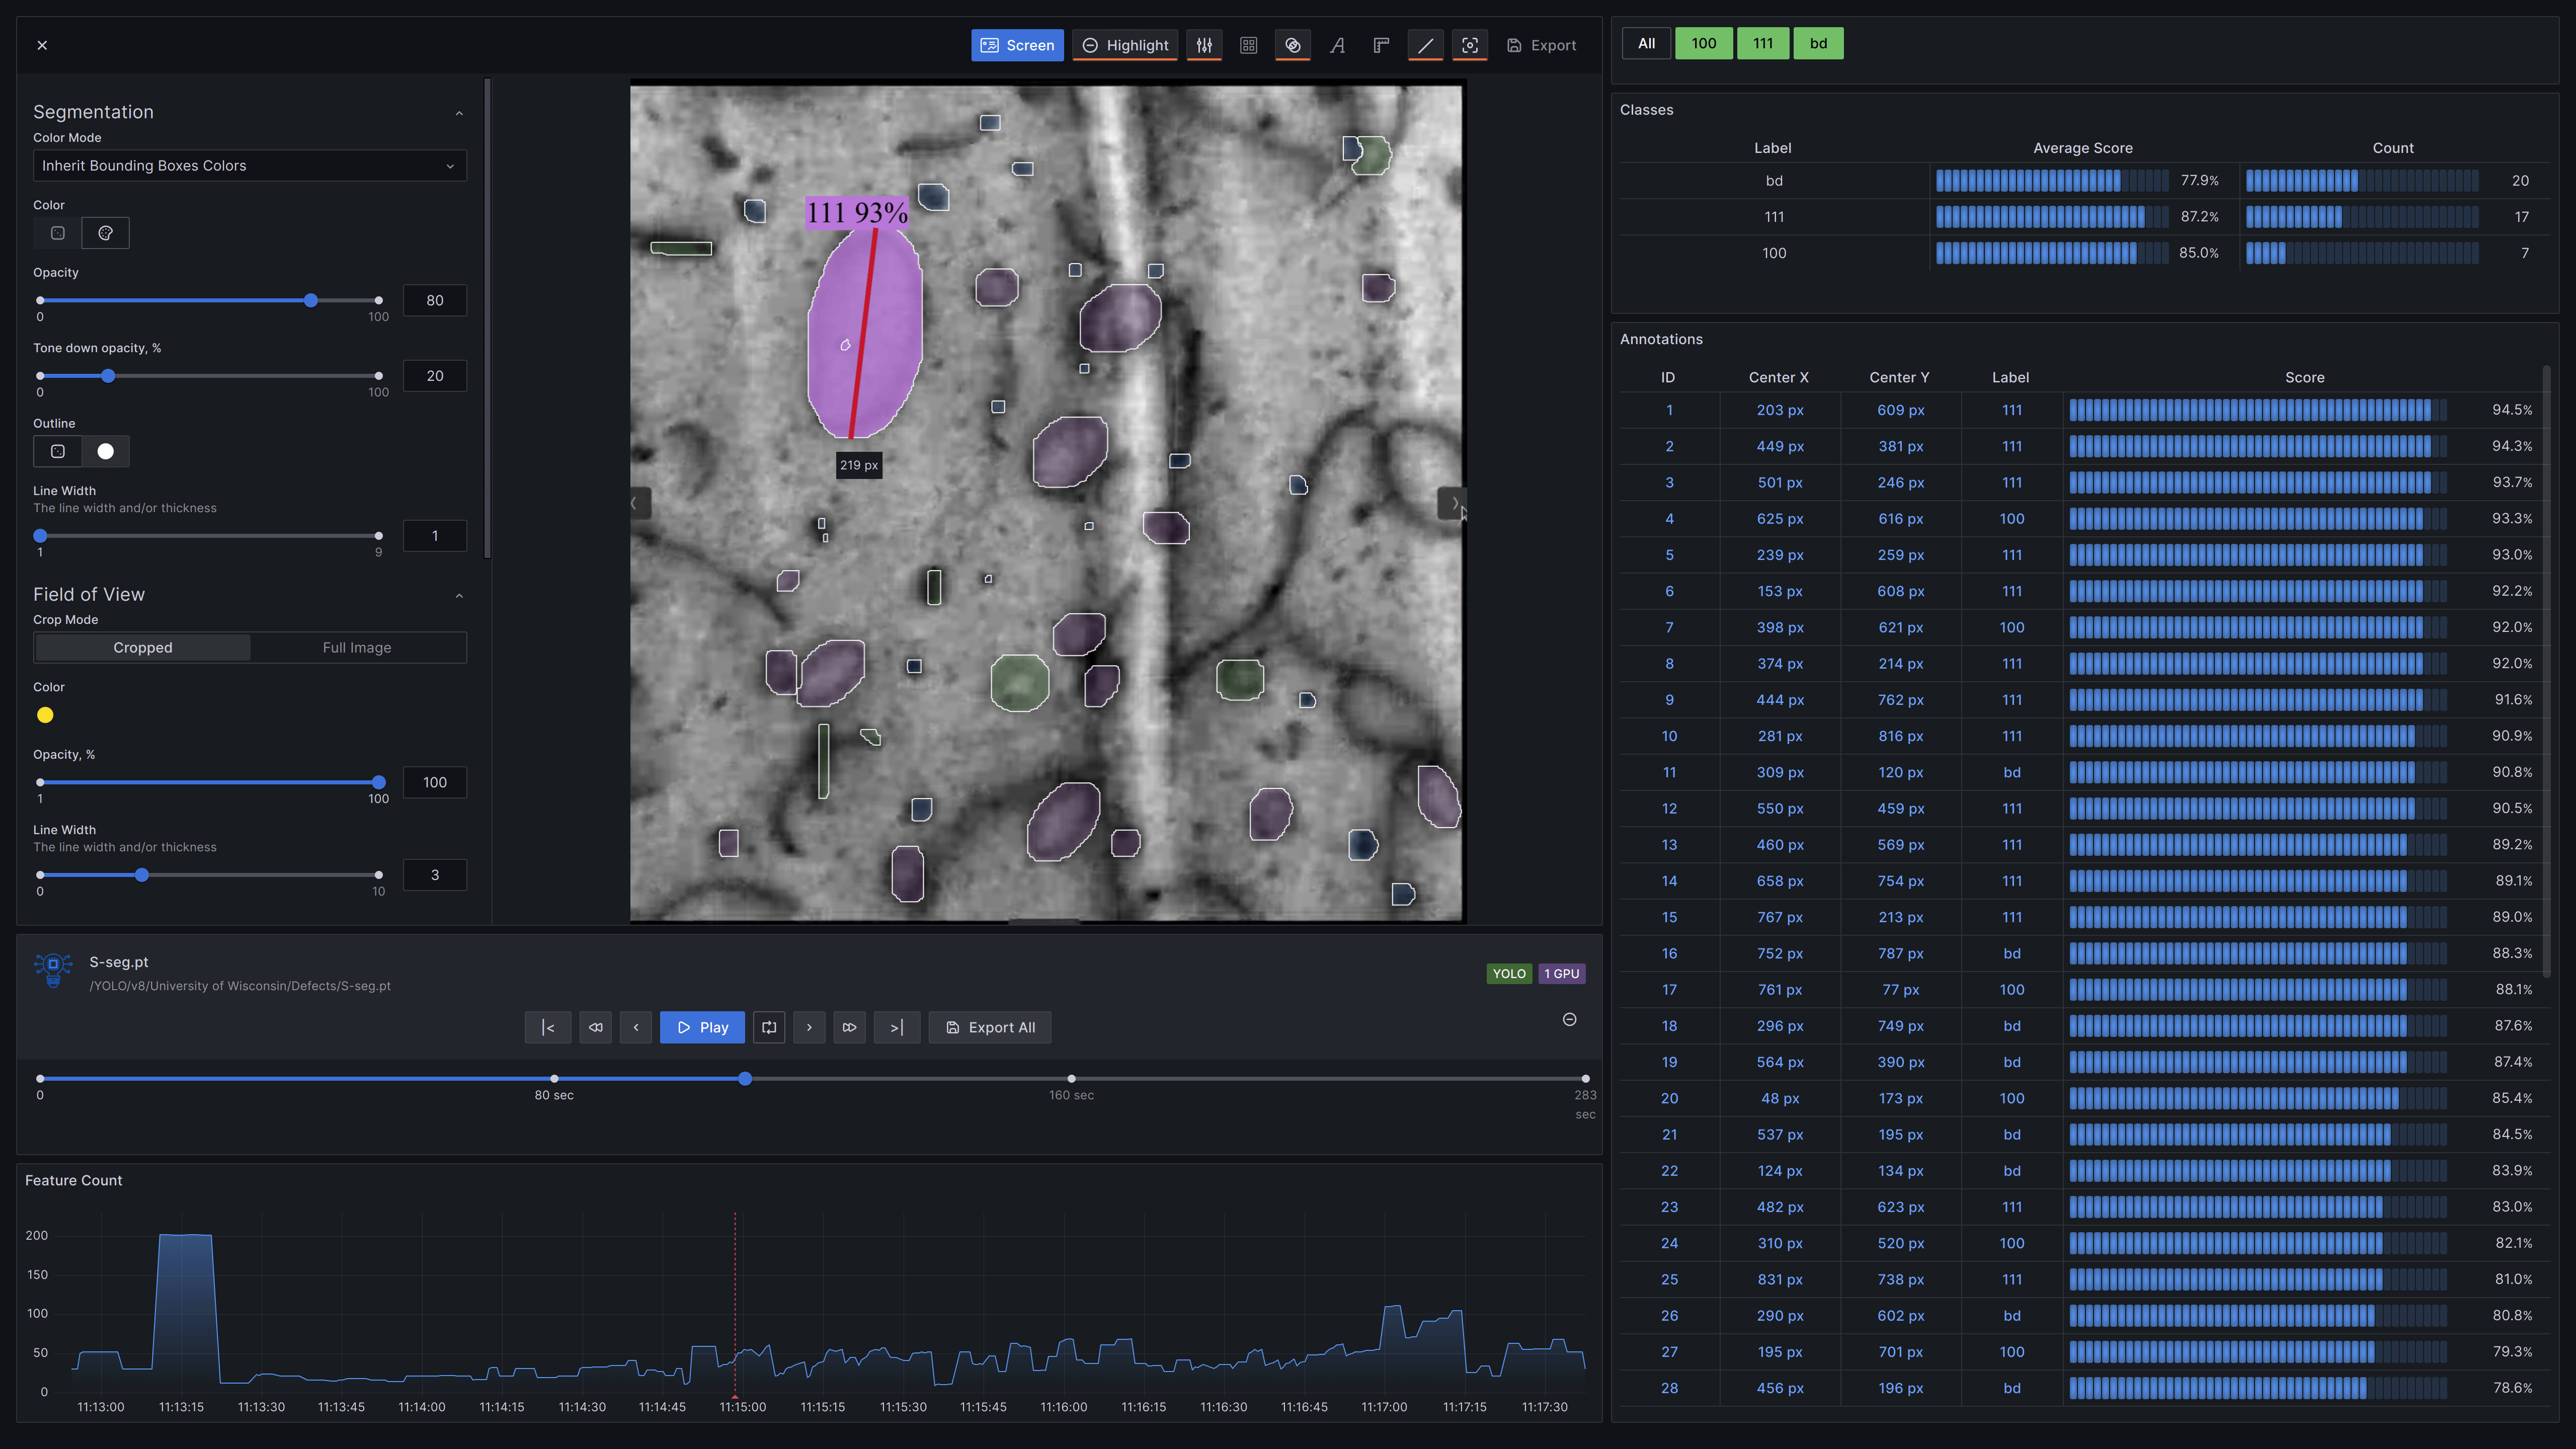
Accelerated discovery with award-winning Grafana dashboards
Christopher founded the Arlington, Virginia-based company with his brother, Kevin, a nuclear scientist. Their software helps researchers stream images from room-sized electron microscopes to a time series database and machine learning models that are used to instantly identify defects. The dashboard is shared internally, and other variations are used by US Department of Energy (DOE) national laboratories and research universities.
With the technology displayed in Grafana, scientists, engineers, and researchers are saving up to 80% of the time it used to take to determine the suitability of an alloy.
“Kevin had spent a decade drawing boxes around black dots by hand for thousands, if not hundreds of thousands of images,” Christopher says. “He never wanted to do that again, and so we set out to fundamentally change the workflow for scientists and engineers that are looking at these materials and looking at these images.”
They work with organizations that beam concentrated radiation at an alloy over the course of a few hours to simulate how that material would hold up over an entire century. The analysis processes went largely unchanged for decades, Christopher says, with researchers taking snapshots every minute or so and going back to assess those images later on.
“What we’ve been able to do now with our dashboard is they can do this analysis and decide if it’s a good material while it’s still running,” Christopher says. “Before, it could be a year and a half to two years before they could make that discovery. And that’s really been the part that’s been the ‘aha moment’ when the microscopists see it or we demo it, and they’re just like, ‘Oh, I can do this now? I don’t have to wait?’”
And while the use case might be atypical for Grafana, it highlights the value of visualizations and how they can help teams focus on what’s truly important to their work.
“[Drawing boxes], that’s not the science, that’s not t that’s not getting your answer,” Christopher says. “So let’s automate that and get that out of the way and get to that point of discovery sooner. Let’s get to our answers faster. And if we can do that at the point of acquisition, then all that much better, right?”
What makes a great dashboard?
The functionality and flexibility of the dashboard clearly stood out to the judges, too.
“Not only is it incredibly useful as it significantly speeds up the process to discover and review changes in defects within steel alloys used in nuclear reactors, but it also goes a step further. It uses custom interactive panels specifically designed for this scenario, which give scientists and engineers opportunities to conduct in-depth analysis of image sets,” says one judge.“It demonstrates how interactive dashboards can foster curiosity and playfulness, aiding in the improvement of the system.”
And as for what advice Christopher would give to others starting to create their first Grafana dashboards, he suggests reaching out to the community for support, starting small, and not being afraid to get it wrong the first time.
“It’s OK to fail and just keep trying,” he says. “Don’t be afraid if it doesn’t quite work the way you want it to, and don’t go in thinking you’re going to have one dashboard to rule them all; try a bunch of different ones and see what happens.”


