Grafana Loki 2.9 release: TSDB volume endpoints, remote rule evaluations, LogQL optimizations
The Loki squad is excited to announce Grafana Loki 2.9 is here! For this release, we’ve developed additional TSDB endpoints to help you better understand your log volume; introduced query language optimizations to make parsing more performant; and restructured our documentation so it is easier to use.
This coincides with the release of Grafana Enterprise Logs (GEL) 1.8, so all the features discussed here are available in both Loki 2.9 and GEL 1.8. For simplicity, we’ll just refer to Loki 2.9 for the remainder of this post.
Let’s take a closer look at some of the biggest highlights of this latest release!
Gain insights on volumes with TSDB endpoints
We’ve talked extensively about our TSDB index and some of the great benefits it provides around resource utilization, query performance, and cost savings. However, we haven’t talked much about the great additional capabilities this unlocks — and we’d like to change that today!
As a part of the index redesign work, we also set out to build an index-only API that could answer whatever questions you have about your logs in a low latency manner. The first use cases we set out to solve were around:
- Volume analysis. “Help me understand where my logs are coming from.”
- Log exploration. “Help me navigate to relevant logs faster.”
To address this, we’ve added /volume and /volume_range endpoints, which allow you to query the index for volume information about label and label-value combinations! Let’s look at a couple of examples.
Let’s say you are running an environment with teams alpha, beta, and gamma, and you want to understand how much volume team alpha sent over the past two weeks. To do this, you would invoke the /volume endpoint, and specify a query parameter of {team=”alpha”} like so:
```
curl -G http://127.0.0.1:3100/loki/api/v1/index/volume?query={team=”alpha”}&start=1693540800&end=1694750400
```

You’d get a response as a prometheus-formatted timeseries like the following:

{
  "status": "success",
  "data": {
    "resultType": "vector",
    "result": [
      {
        "metric": {
          "team": "alpha",
        },
        "value": [
          1693932712.003,
          "14928180160"
        ]
      }
    ]
  }
}
____
Notice the query parameter is, quite helpfully, a valid LogQL parameter!
This can be expanded upon, too. Let’s say you want to see this same information for each team label. You can modify the query parameter to:
{team=~”+.”}Finally, let’s say you wanted to see different combinations of labels by applying filters. Maybe you want to learn what volume each “team” label was in the prod environment. The query parameter would be:
{team=~”+.”, env=”prod”}There are a few different ways you can slice and dice the parameters, depending on what information you are trying to get — which services are the most logged, how many logs have a debug label, and more. Notably, there is also a time series endpoint ( /volume_range), which allows you to see this data over time with the addition of a step parameter.
Take a look at our docs to see how these TSDB volume endpoints work, and try them out yourself. We’re excited to continue to build out these APIs, and, in the future, leverage them to provide new curated experiences around log exploration, cost management, and more!
Increased ruler reliability with remote rule evaluations
Alerting and recording rules can now be evaluated with all the parallelism and speed of Loki’s query engine. Previously, rules were evaluated on Loki’s ruler component in a single-threaded manner. This approach can lead to missed evaluations if a rule takes longer than the group interval to complete, or if there are a large number of rules to evaluate. This, in turn, can lead to alerts not being sent and gaps in metrics produced by recording rules.
In Loki 2.9, rulers can send queries to the query-frontend component, which parallelizes the execution of queries across all querier components. Read more about it here.
Restructured docs to help you start exploring faster
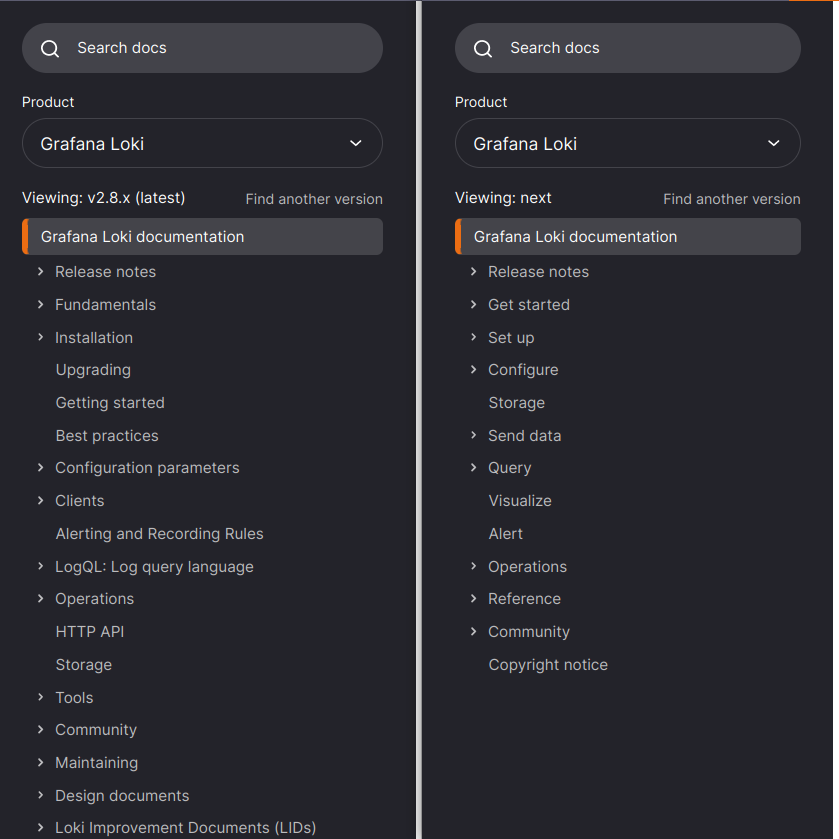
We reorganized the structure of our docs to make it easier for you to navigate to the information you need. The naming conventions should better align with the actions you take to use Loki. Notably, we’ve also organized them to better align with our Grafana Mimir and Grafana Tempo sister teams.

We’d love to hear what you think! And we’re excited for what’s next, as we continue to make improvements and refresh the content itself.
More highlights
In addition to what we’ve already discussed, here are some other Loki 2.9 updates we want to call out:
- Query performance improvements. We’ve added LogQL optimizations that speed up line parsing and regex parsing.
- Index multi-store support. You can now use a new storage bucket (same or different cloud provider) by specifying a new period config.
- Support for IBM Cloud Object Storage. This was a community contribution — thank you to @athira_vargese for the contribution!
For other notable improvements, check out the Loki 2.9 release notes.
Try Loki 2.9 today!
For a full list of changes, please consult our CHANGELOG. And if you are looking to upgrade to Loki 2.9, please view the upgrading guide to do so properly.
And if you run Grafana Enterprise Logs, be sure to check out the release notes and documentation for GEL 1.8, which is based off of Loki 2.9, so you can enjoy all the amazing changes made to the upstream OSS project!
We’re thankful to our community of users and contributors for making Loki a successful project. Feel free to drop in on Slack, or one of our monthly community calls, to tell us what you think of Loki 2.9.
If you’re not already using Grafana Cloud — the easiest way to get started with observability — sign up now for a free 14-day trial of Grafana Cloud Pro, with unlimited metrics, logs, traces, and users, long-term retention, and access to all Enterprise plugins.


