

Grafana 1.9.0-rc1 Released!
New release today! v1.9.0-rc1 is now available for download.
play.grafana.org is updated to run 1.9.0-rc1. There is also a New features in v1.9 dashboard that highlights some of the new features.
No breaking changes, so update should be problem free. But this is a release candidate so there could be some bugs.
Release highlights
1) Singlestat panel
This release marks the introduction of a new panel!
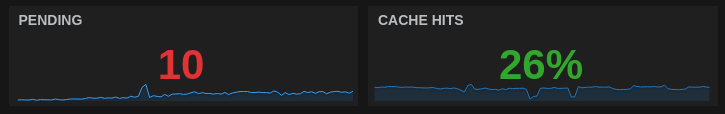
A multitude of options makes this panel pretty flexible.
- Add sparkline to the bottom of the panel
- Add text before/after the value
- Add color thresholds for the value or the panel background
- Control font size
- Adding a panel link makes the whole panel act as a link to another dashboard
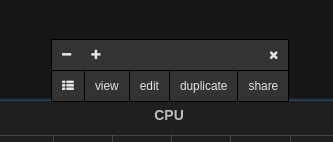
2) Share panel feature
Click on panel title area (anywhere works, does not need to be the title text) to open the
new panel menu. Click on the share button to open the new share dialog. In this dialog
you get a URL to that panel with the current time range and any template variables
embedded in the URL.
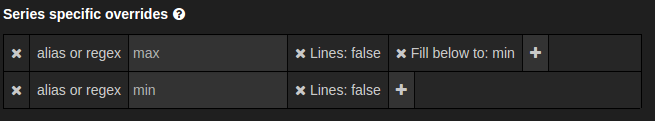
3) Fill below to
An new series specific style has been added in this release that is very useful when visualizing max/min as shadow behind an average.
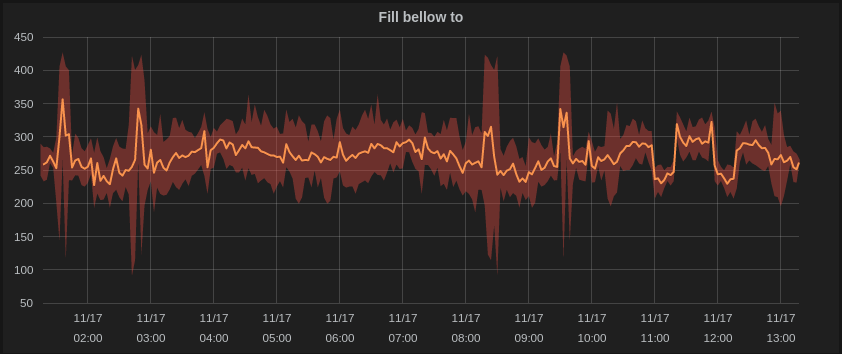
This display style is specified by adding a series override rule for the series above (ex. max). The value of the option is the series name to fill to (ex min).
Example:
4) Other graph features & enhancements
- Shared tooltip option, shows every series when hovering
- Toggle legend from panel menu
- Improved legend table mode look
- Sort legend series (only works in table mode)
- Multi graph crosshair line (shows a vertical red line where you hover on all graphs)
5) Panel links
In the General tab you can now add links to other dashboards or absolute links to other web apps. These links can then be accessed from the panel menu. Links to other dashboards will preserve the current time range.
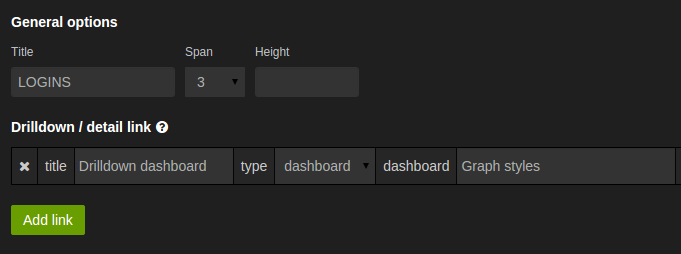
You access these links from the panel menu dropdown. The whole singlestat panel will act as link if a drilldown / detail link is added to the panel.
Metrics meetup in San Francisco, December 3rd
I will be flying to San Francisco on November 28th and will stay for one week. Rackspace will be hosting a metrics meetup on December 3rd at their office on 620 Folsom St. I will be speaking about Grafana (showing new and upcoming stuff) and Rackspace will be speaking about there open source time series system Blueflood.
Meetups, Conferences & Company talks/coaching
If you want me to come and talk about Grafana, application metrics, build measure learn or Graphite. Please email me at torkel@grafana.org. I live in Stockholm Sweden so travel could be an issue, but I am flexible and available :)
Cheers & keep on graphing!
Torkel
Big thanks to my sponsors


