
Gain real user monitoring insights
Grafana Cloud Frontend Observability is our hosted service for real user monitoring (RUM) that provides immediate, clear, actionable insights into the end user experience of web applications. You’ll get RUM data on real-time frontend health, track frontend errors, and resolve issues with end-to-end visibility across your stack.
Get started with the Grafana Cloud free tier: 50k frontend sessions.
Understand the actual end user experience
Monitor and report on Web Vitals to optimize your website and application performance for users.
Troubleshoot user-facing issues
Reconstruct user behavior leading up to an issue and correlate the data with backend requests when debugging performance issues.
Reduce MTTR for frontend errors
Look into similar errors that are automatically grouped for you and investigate issues down to specific lines of code.
Why use Grafana Cloud for frontend monitoring?
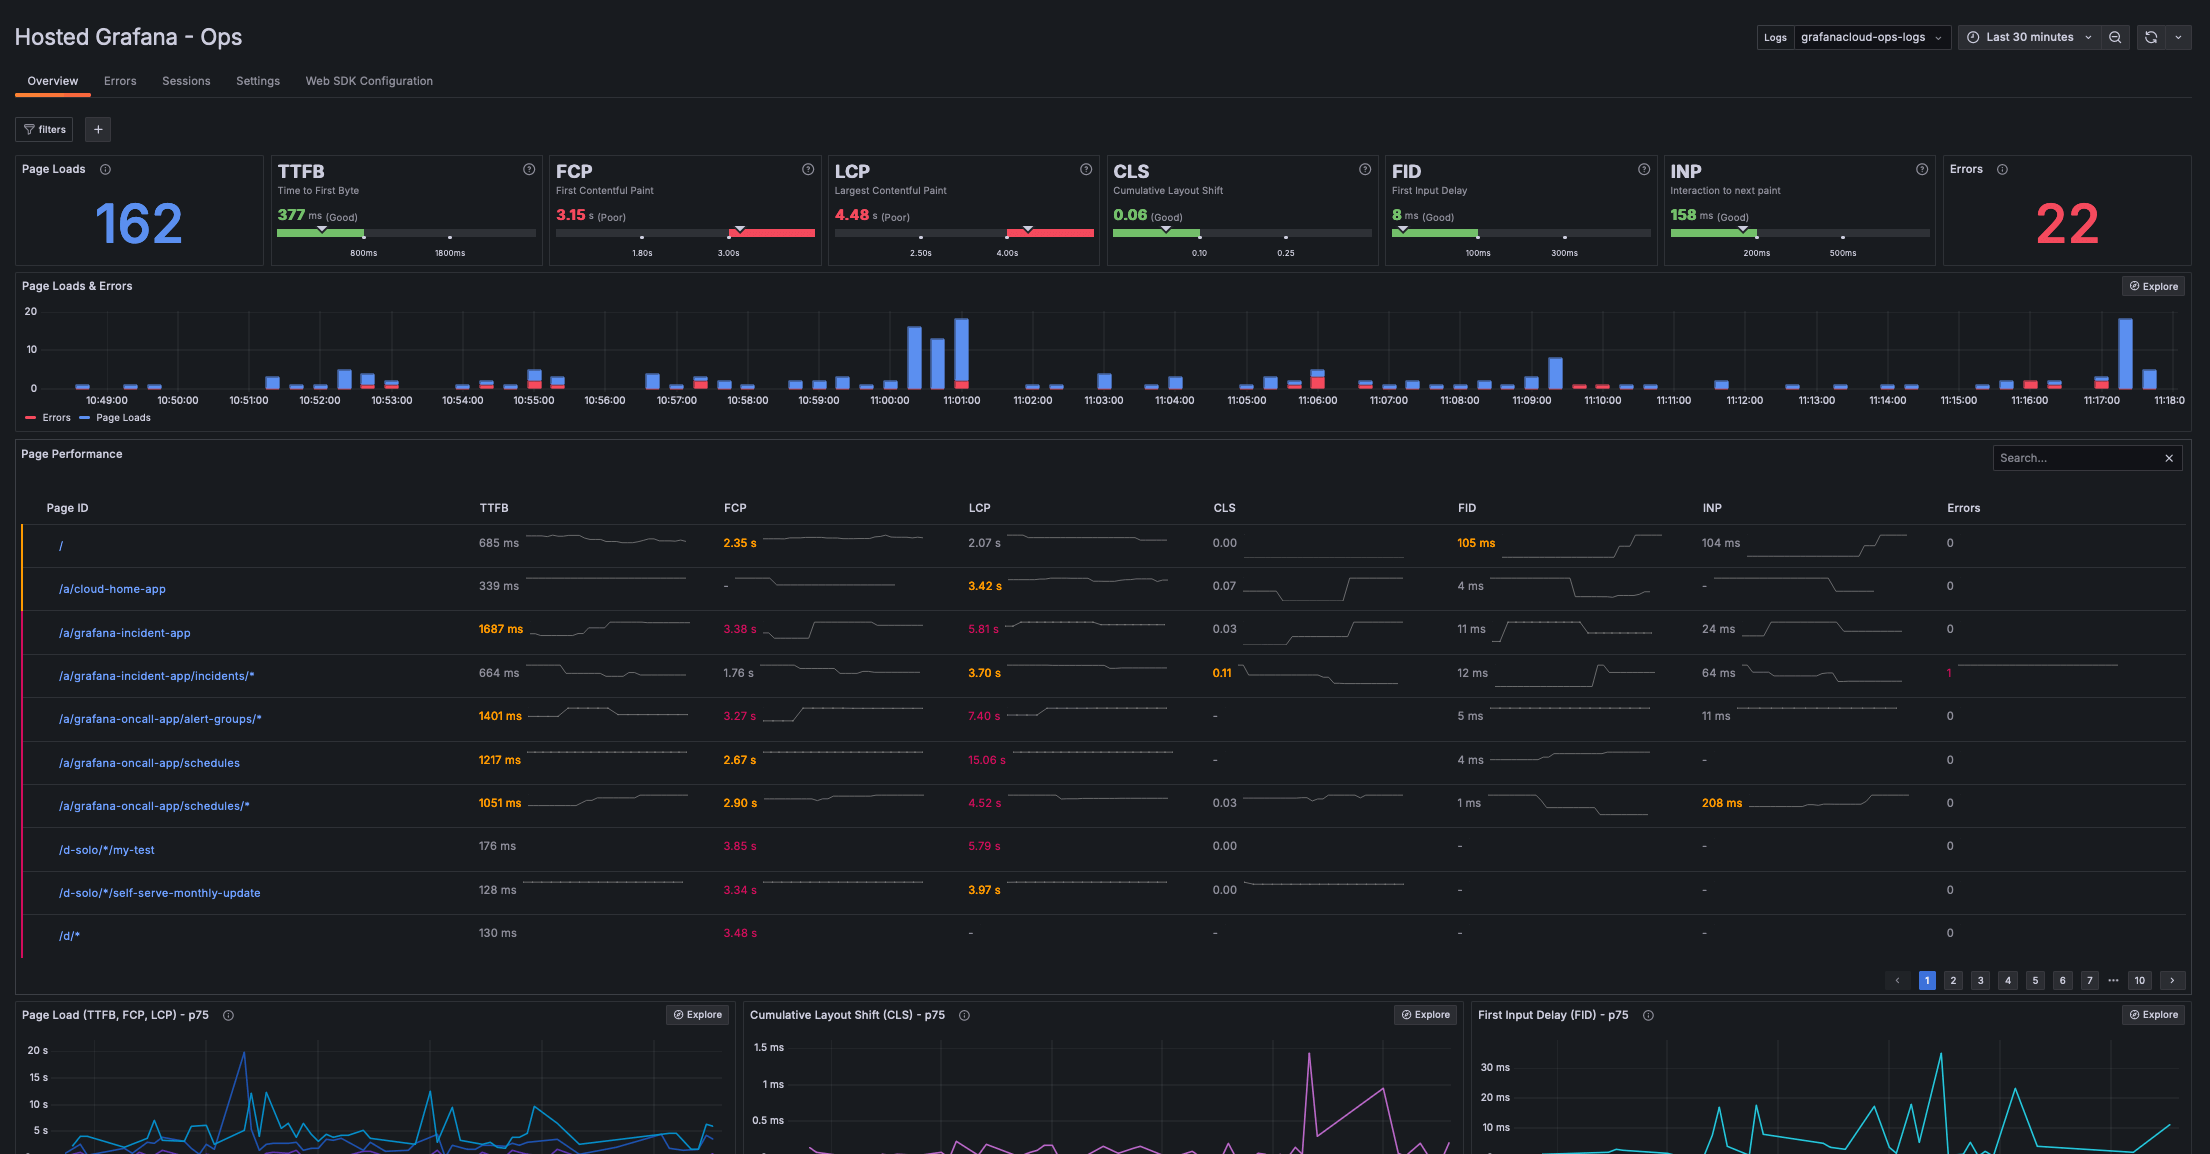
Monitor end user experience
- Measure page load times, user interaction, cumulative layout shift, and more critical metrics for understanding and delivering a great user experience.
- Slice and dice performance metrics in ways that align with your business goals — e.g., by device type, application version, or session ID — and learn more how certain users interact with your site.
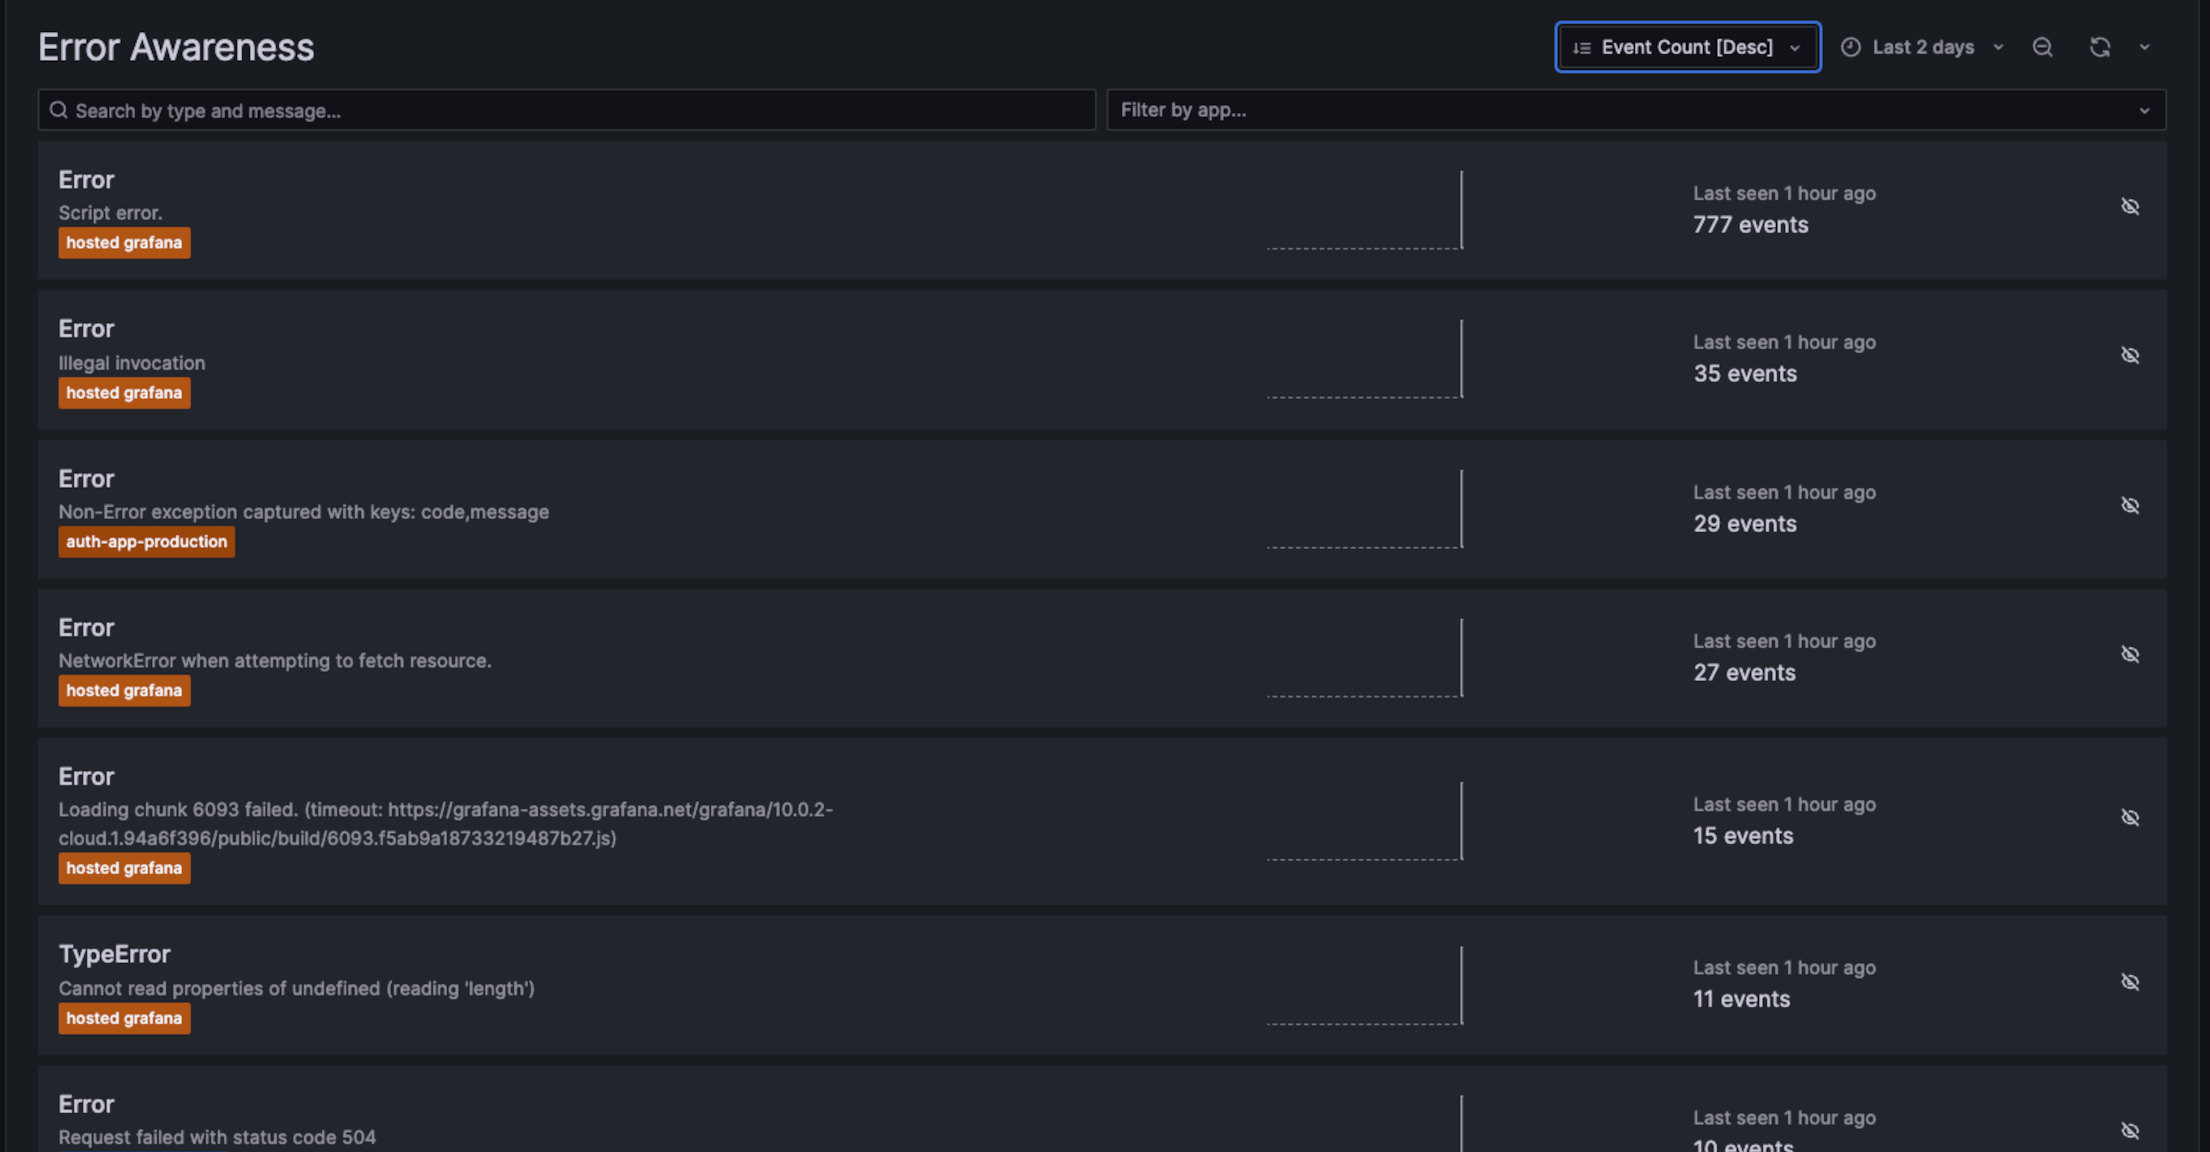
Track errors with complete stack traces
- Assess the severity of frontend errors based on volume and frequency.
- Investigate each issue with helpful contextual metadata.
- Narrow down the source of an error to specific lines of code by unpacking JavaScript stack traces.
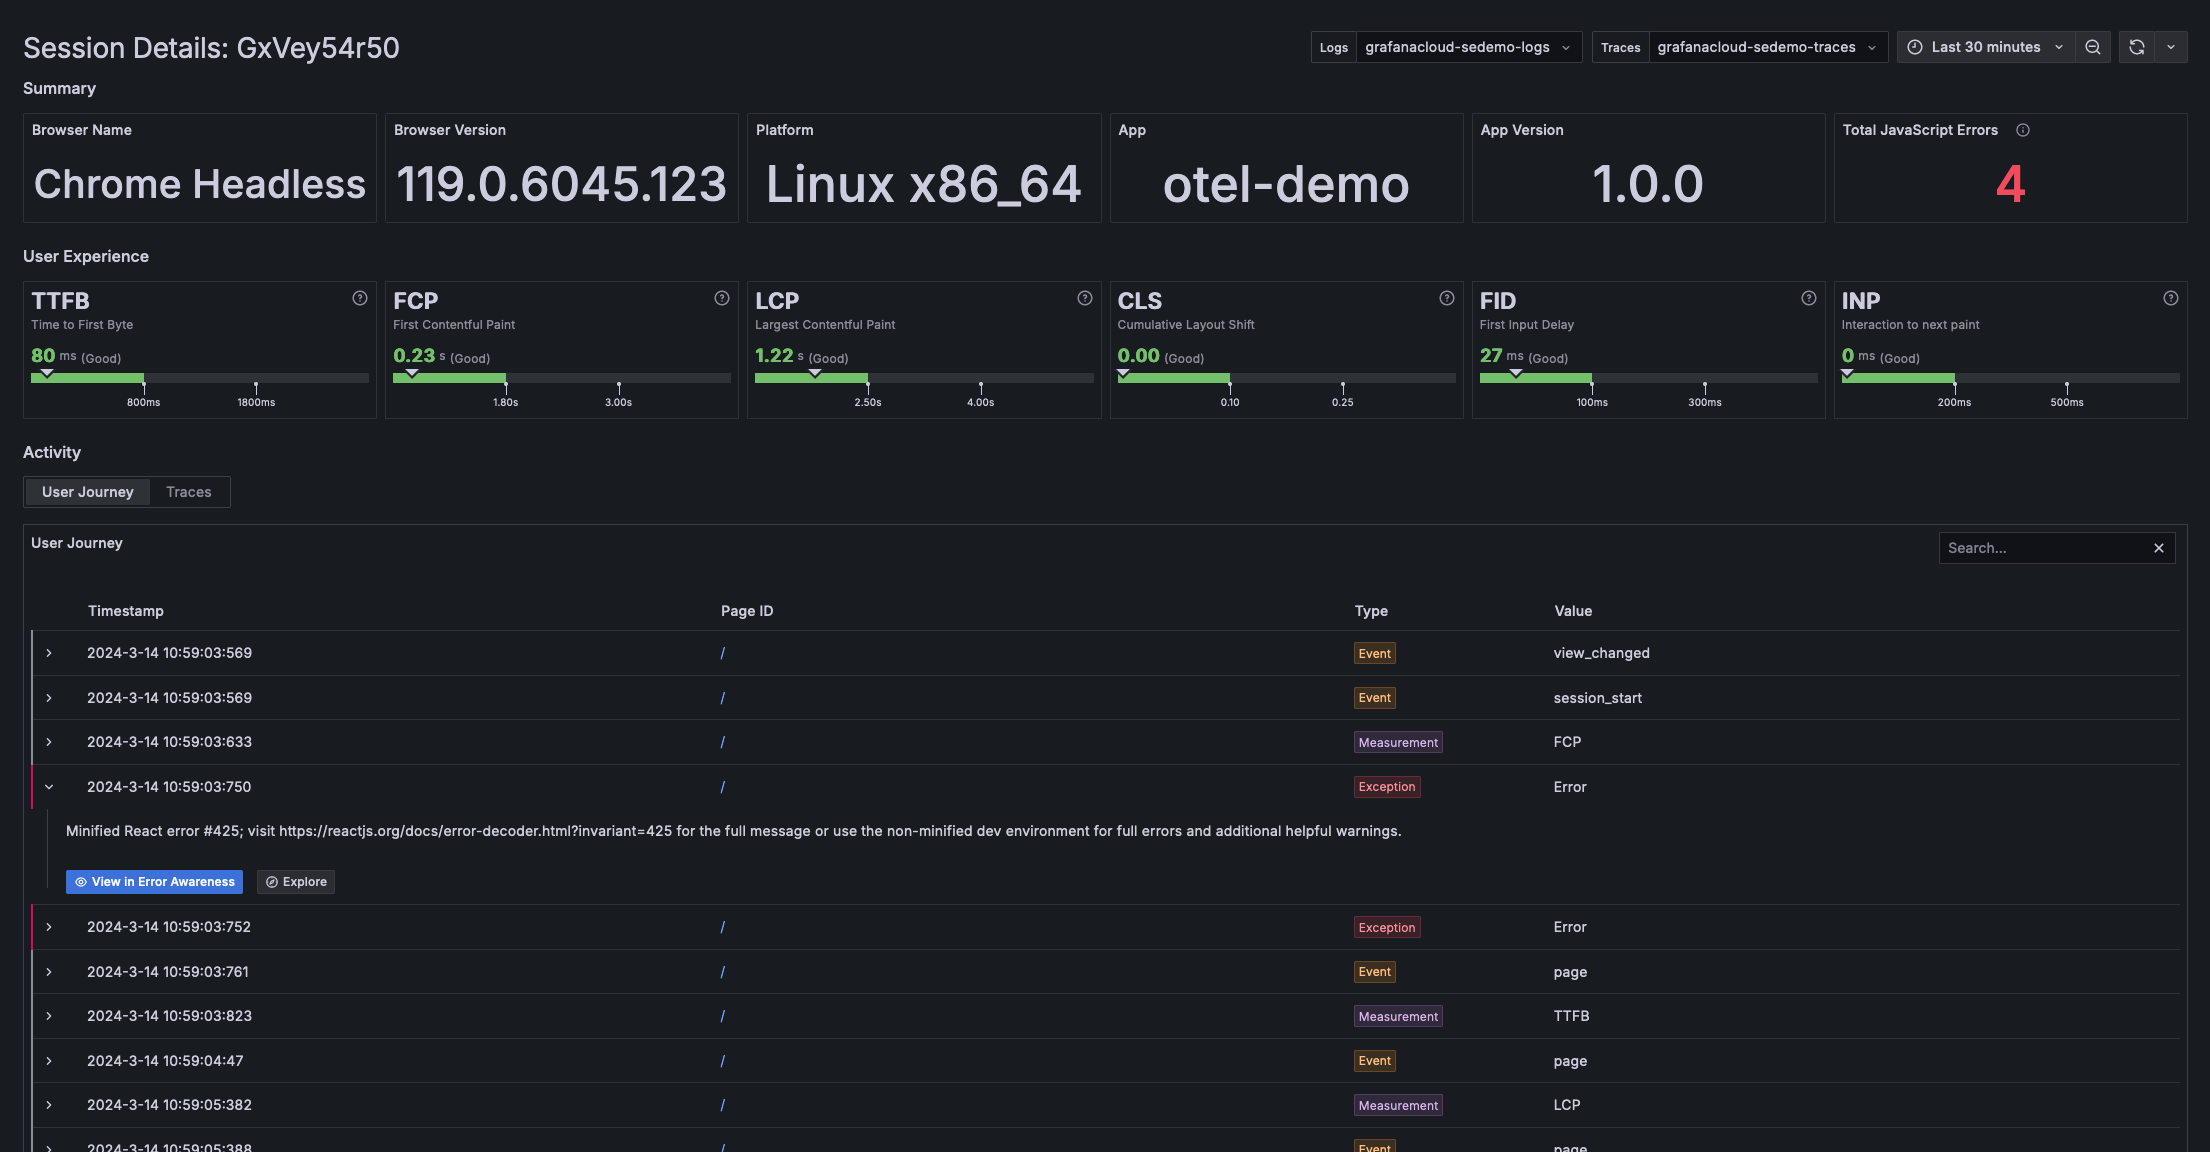
End-to-end visibility into every user interaction
- Find user sessions based on any parameter.
- Reconstruct the timeline of events in a user session.
- Correlate a frontend session with request traces to gain full-stack visibility.
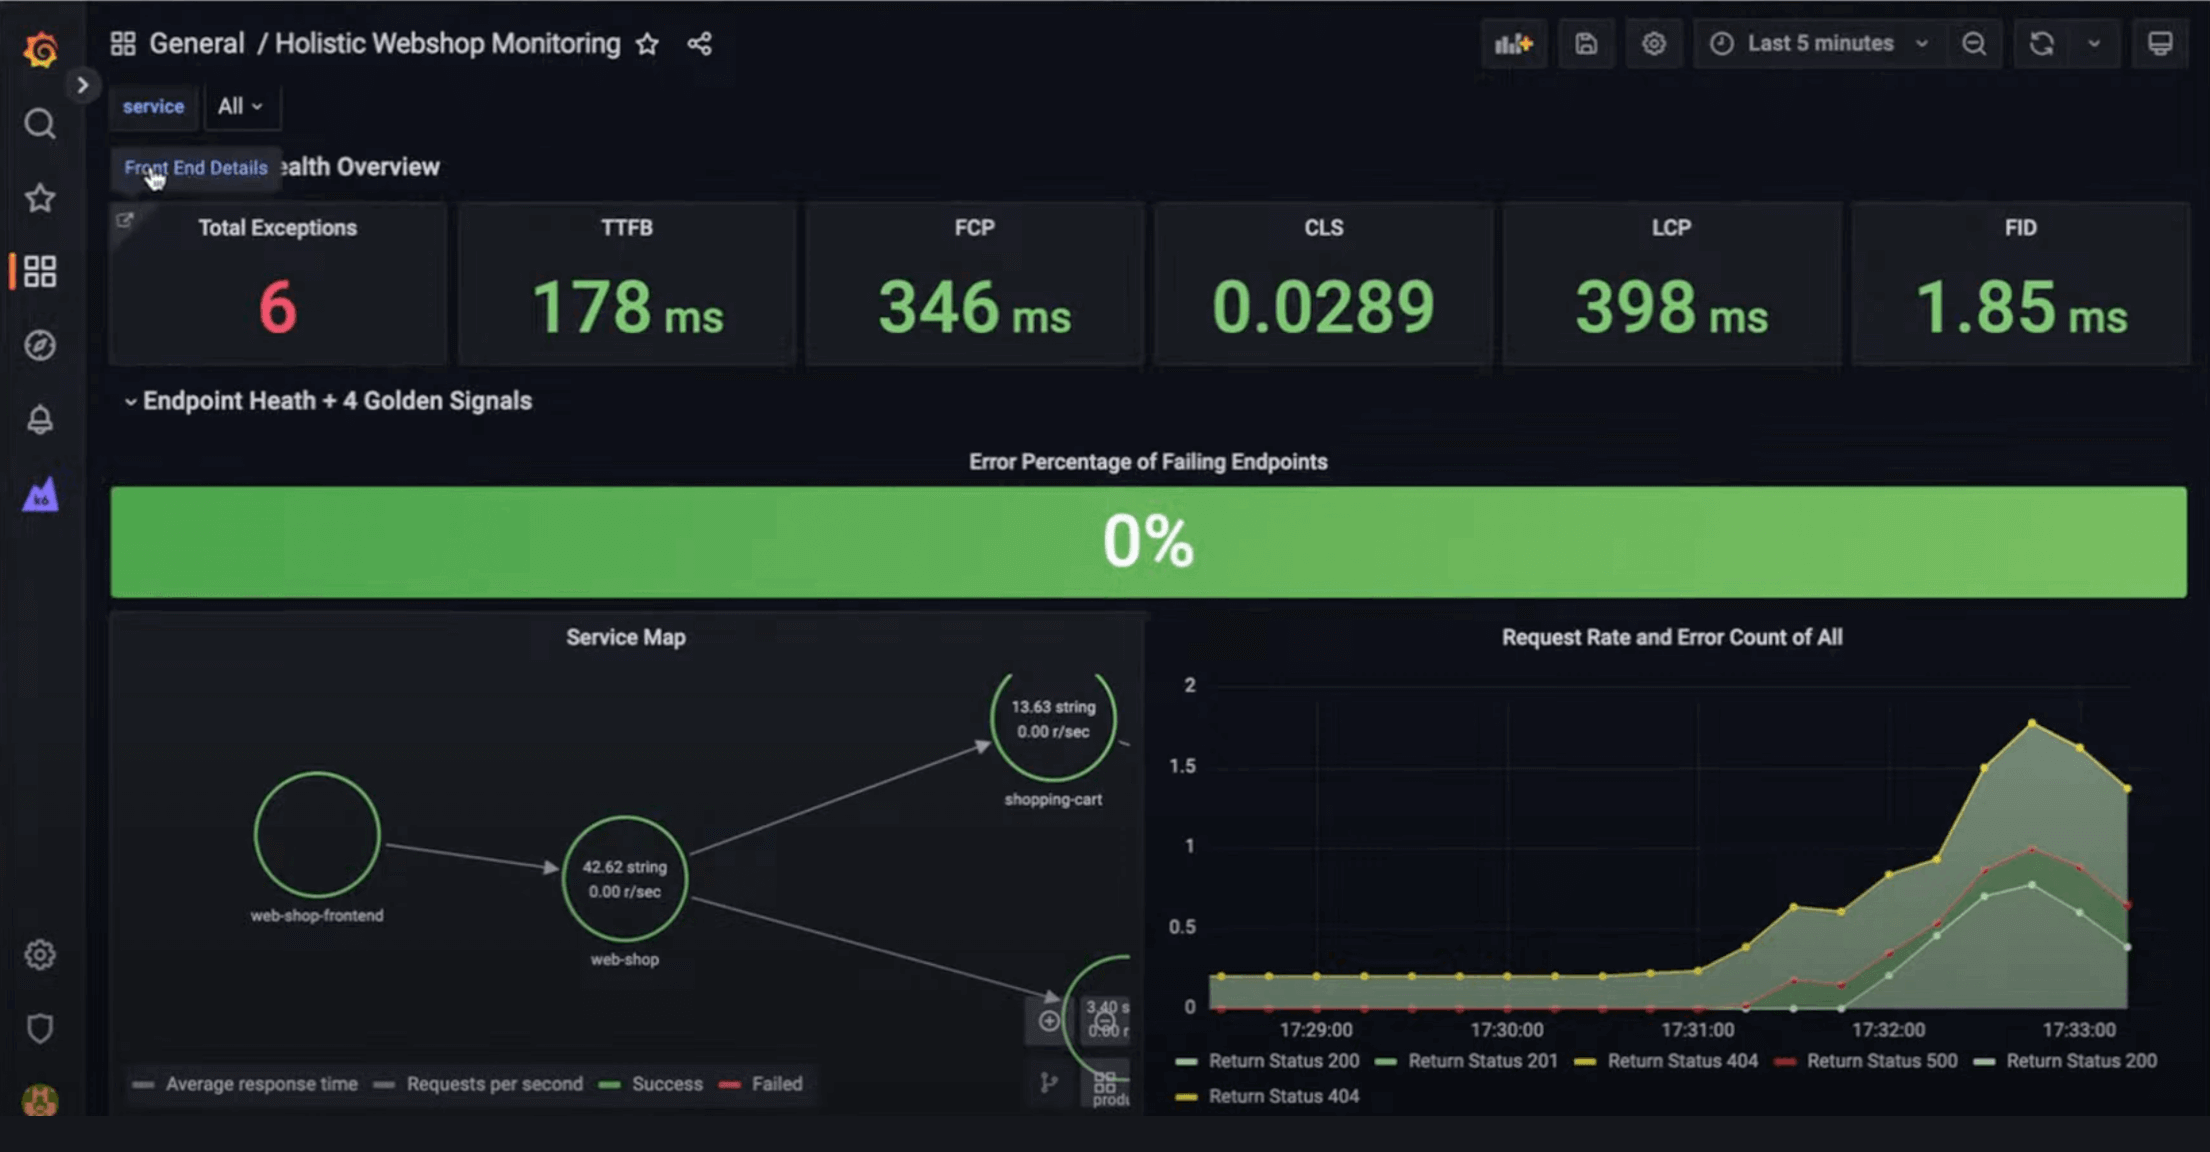
Build custom Grafana dashboards
- Frontend performance data is stored in Grafana Cloud Logs, exposed as Prometheus metrics, and visualized in Grafana for flexible analysis and reporting.
It’s easy to get started with Grafana Cloud Frontend Observability
Register an application
Add the Grafana Faro Web SDK to application
Enjoy out-of-box insights
For full implementation details and best practices,